Concept project · AI money assistant inside a mobile banking app
Project
Turning Spending Data into Smart Next Steps
platform
Mobile banking app (iOS & Android), concept. Four tabs: Overview, Spending, Forecast, Plan.
Responsibilities
End to end: frame the problem, map six everyday money problems and choose one to solve deeply, design how AI shows up in the flow, build every screen and state, wire a clickable prototype, then review my own work with a cognitive walkthrough and heuristic evaluation and ship a v2.
Feature
An AI layer inside the banking app, not a chatbot. It explains why spending changed, compares it with the user’s own normal month, forecasts the month-end balance, lets them test a “what if”, and turns one insight into a small goal they control.
Overview
Banking apps already show a balance, transactions and a spending total. They don’t show why the number moved or what to do about it, so users interpret the data themselves. I focused on one loop: understand the change → see where the balance is heading → commit to a small plan → track it. This case study follows the work from problem framing to the AI interaction model, final UI, a self-review that found and fixed the critical issues, and a plan to validate it.
1. Case Study Overview
a. Problem Framing
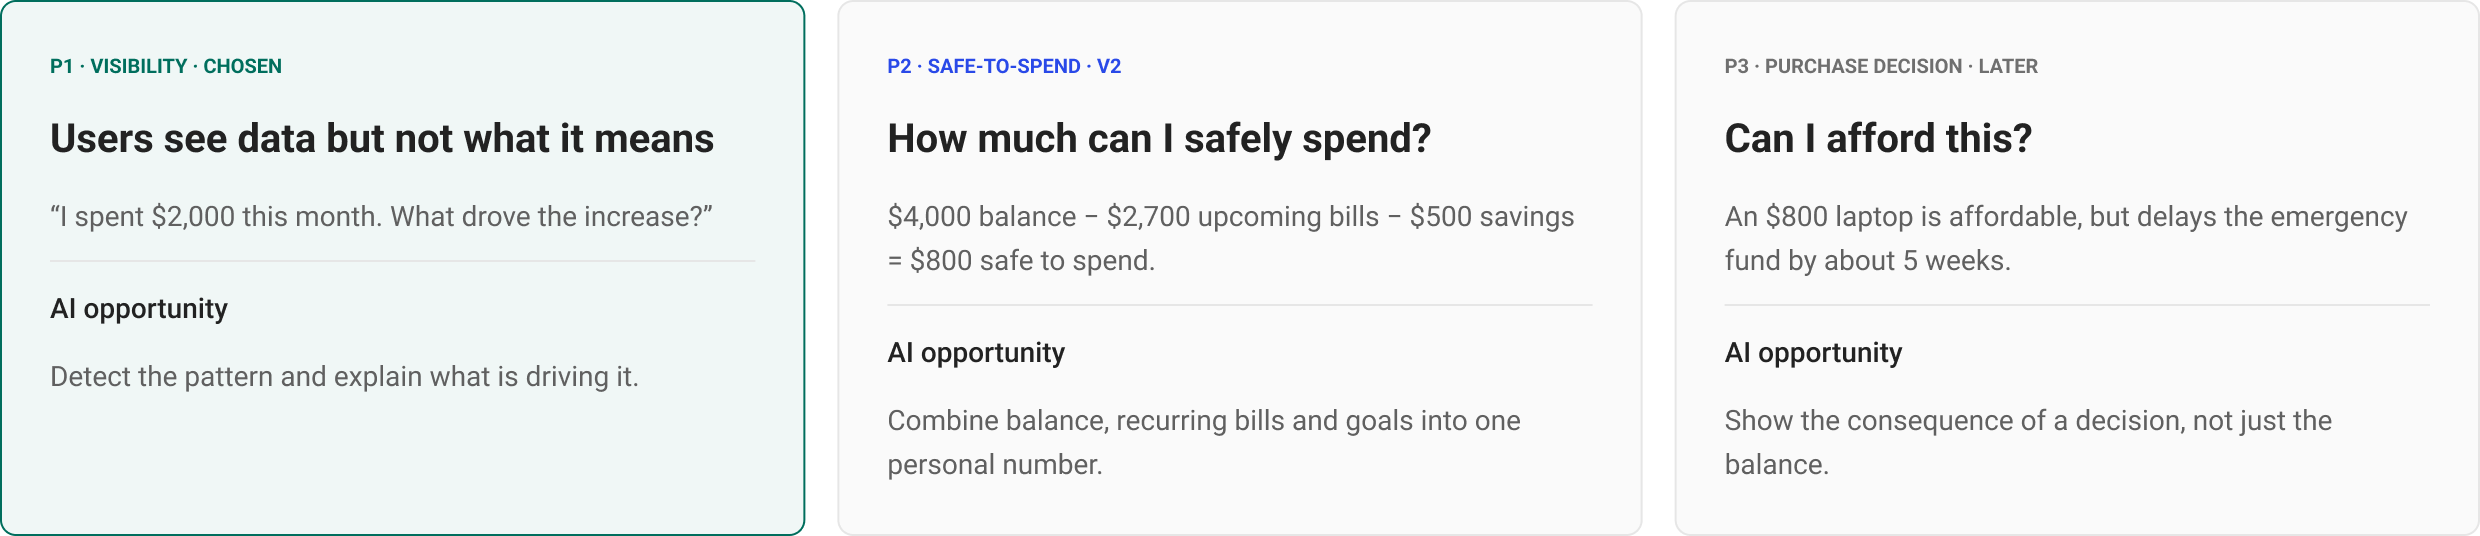
Six everyday money problems, one chosen
Why current banking apps fall short
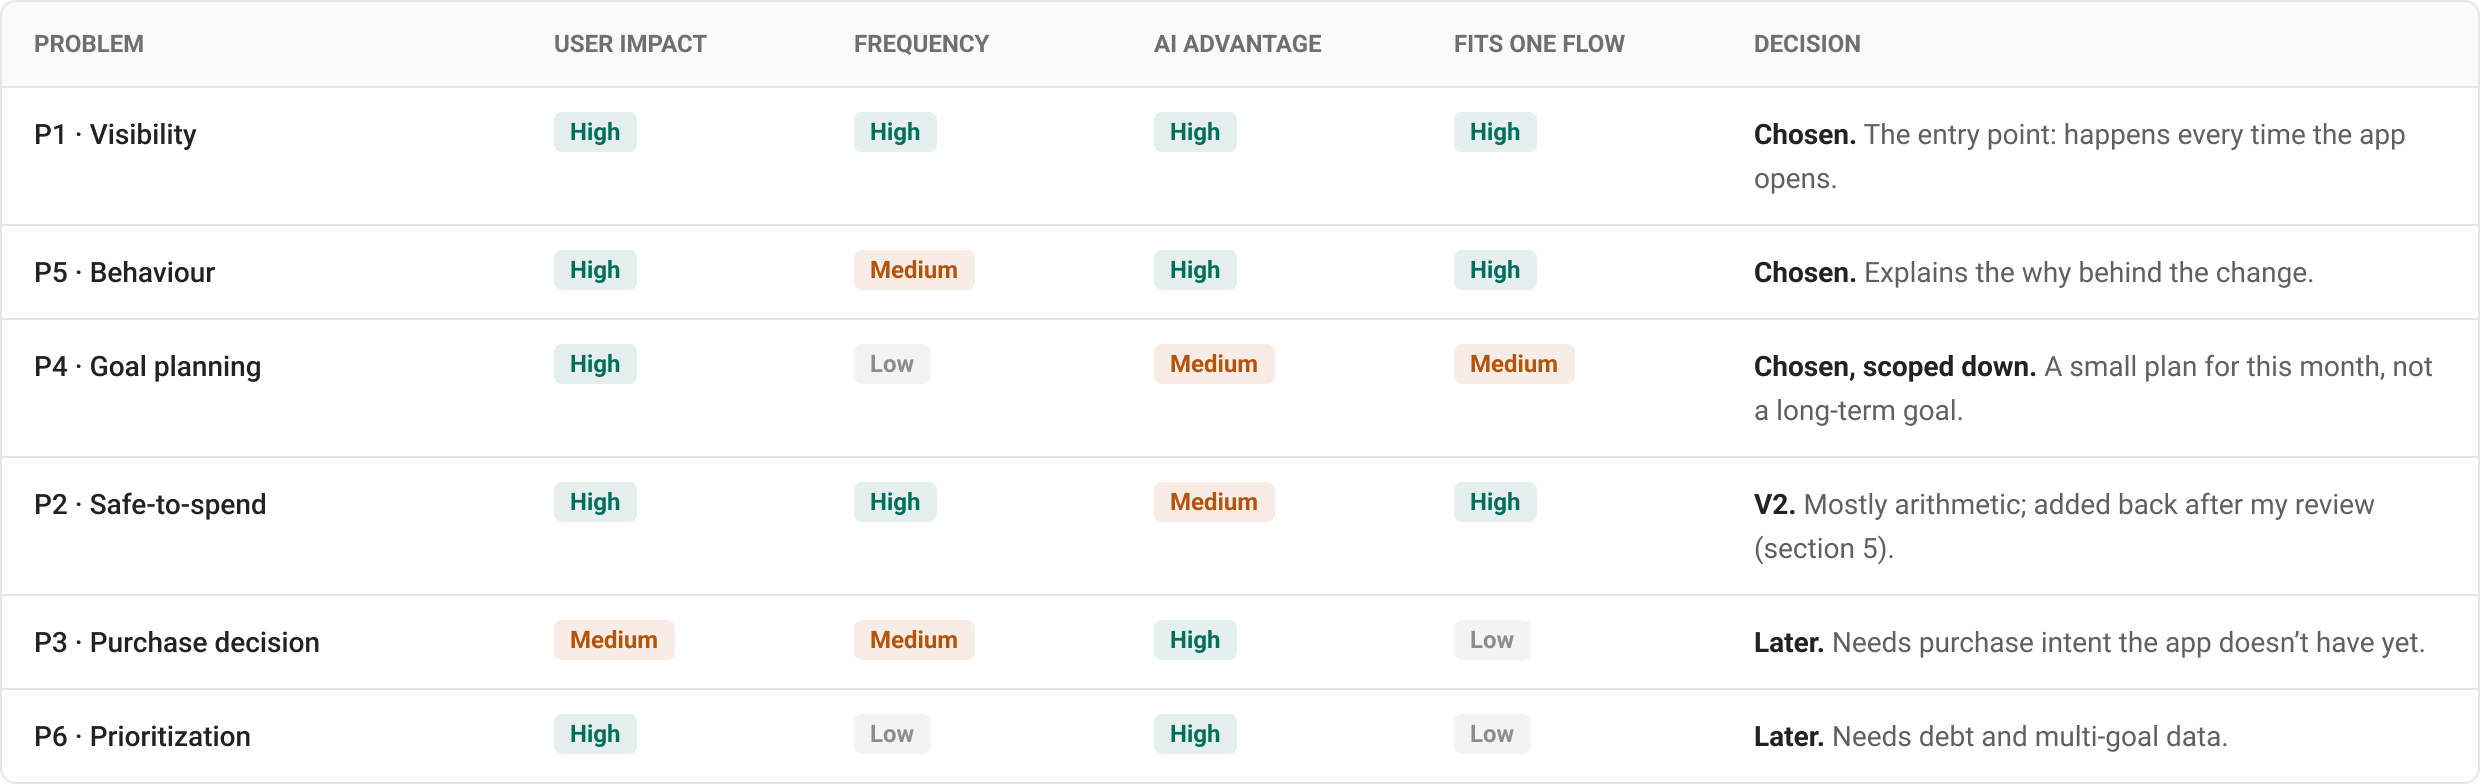
Choosing by impact, frequency and AI advantage
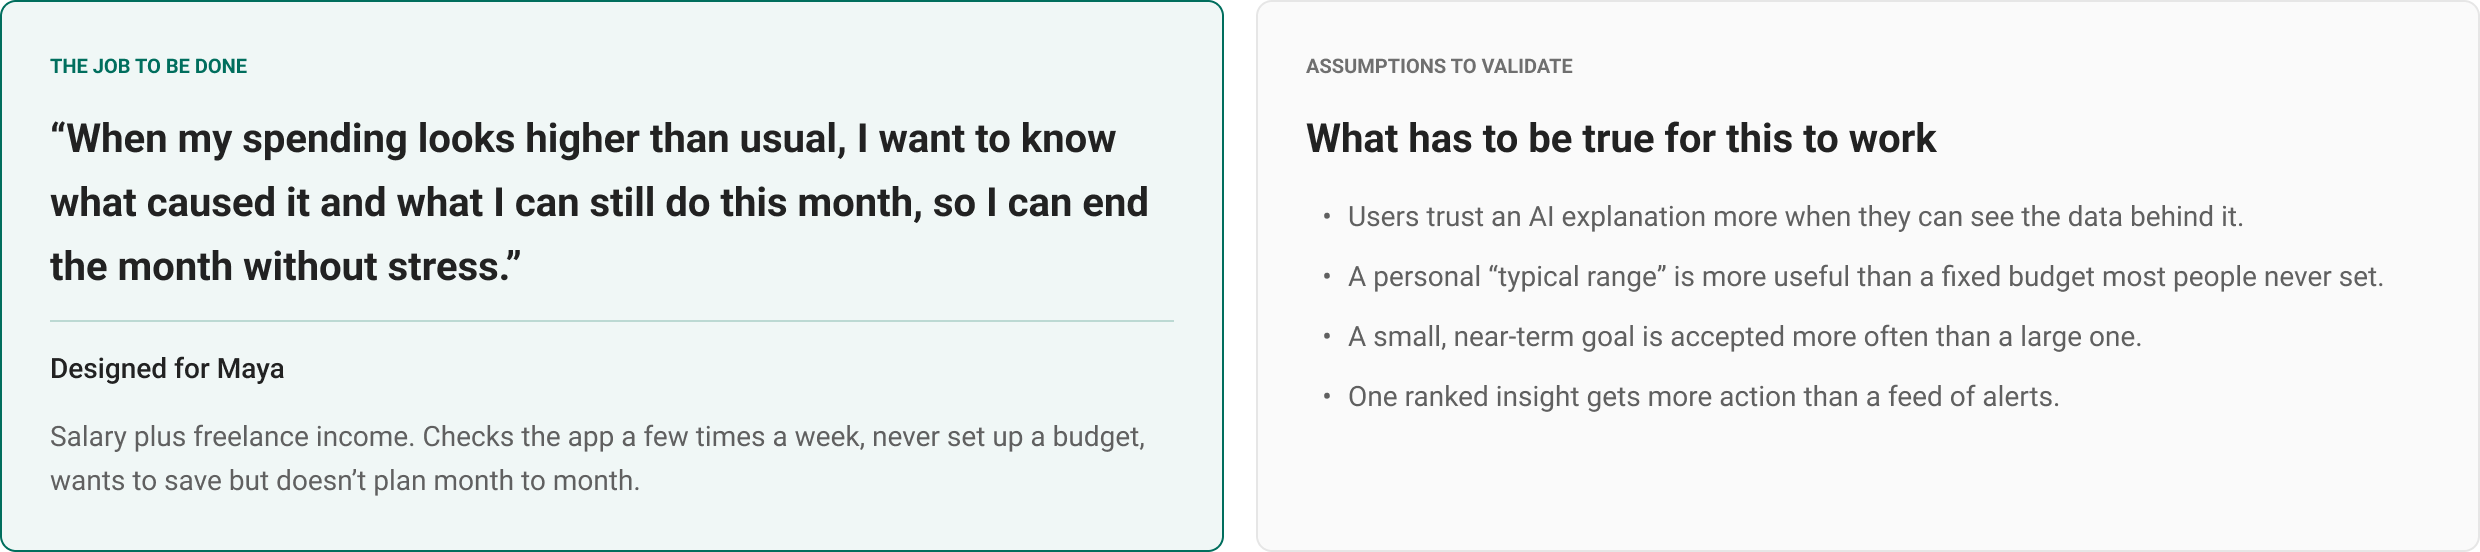
The job: “help me understand and act”
c. Final UI & Edge Cases
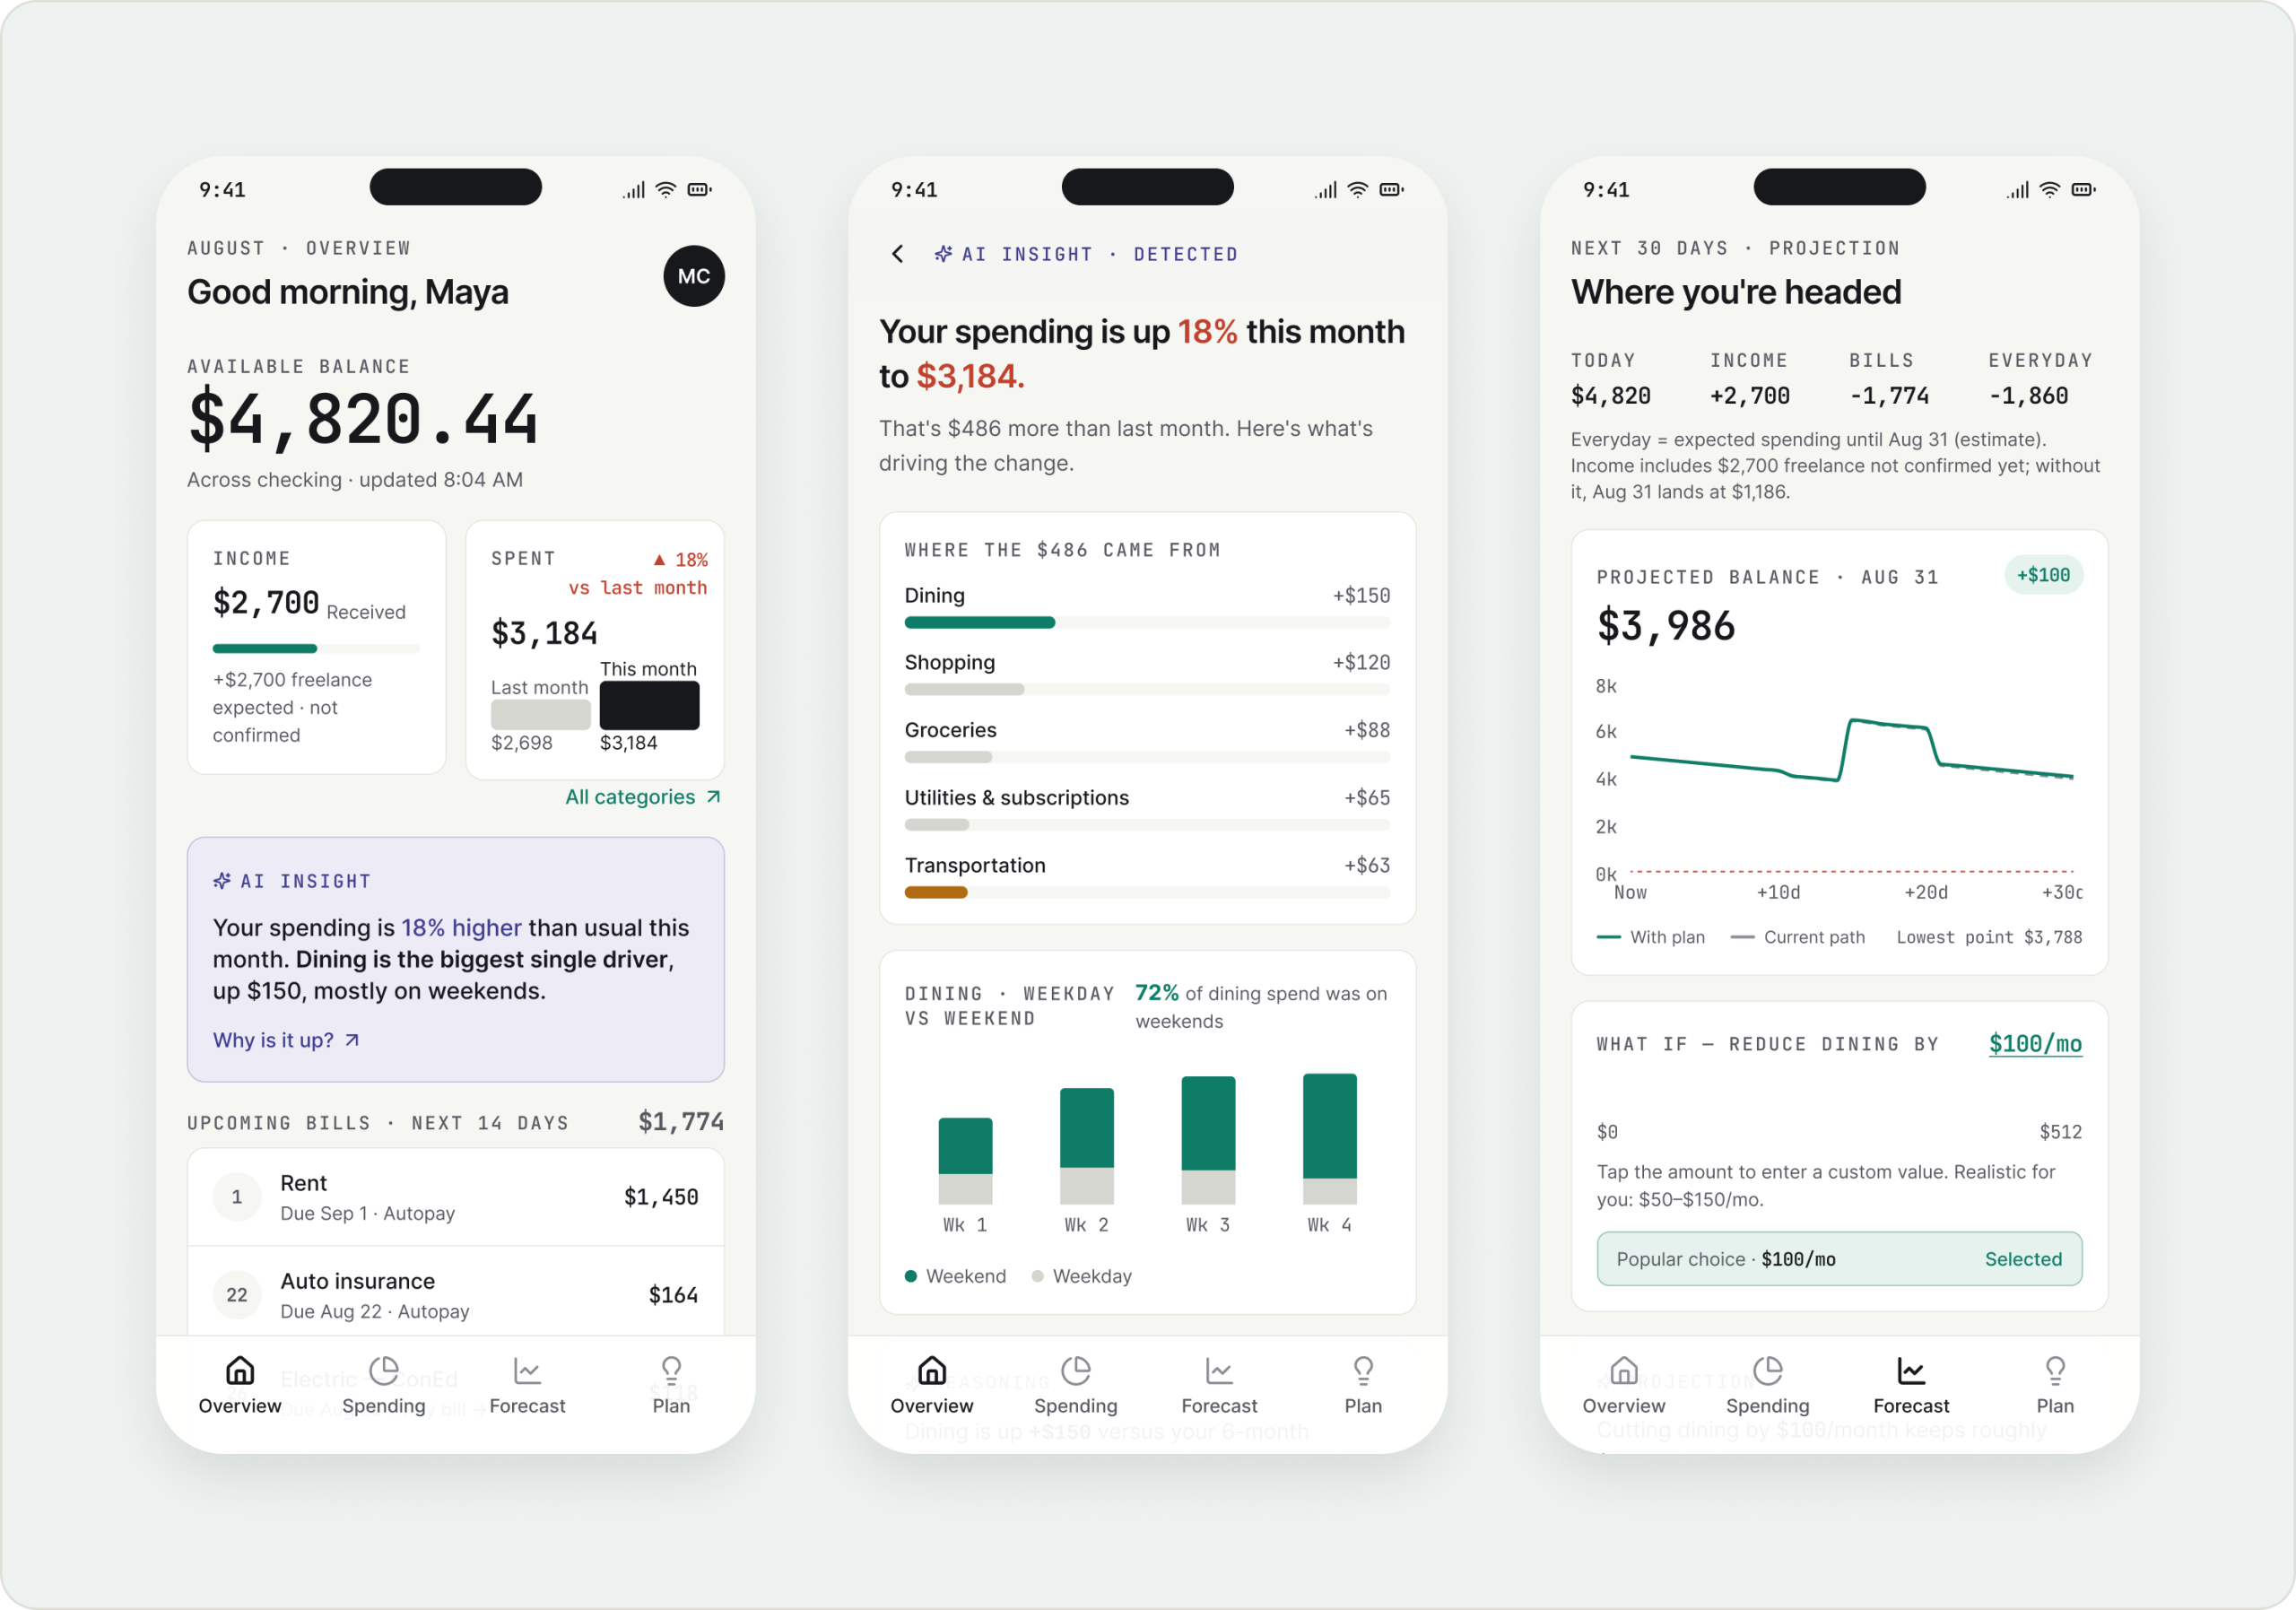
Overview with one ranked AI insight
Insight detail, Spending, Forecast & what-if
A small plan the user controls, and its follow-up
14 full screens wired as a prototype
b. AI Interaction Model & User Flow
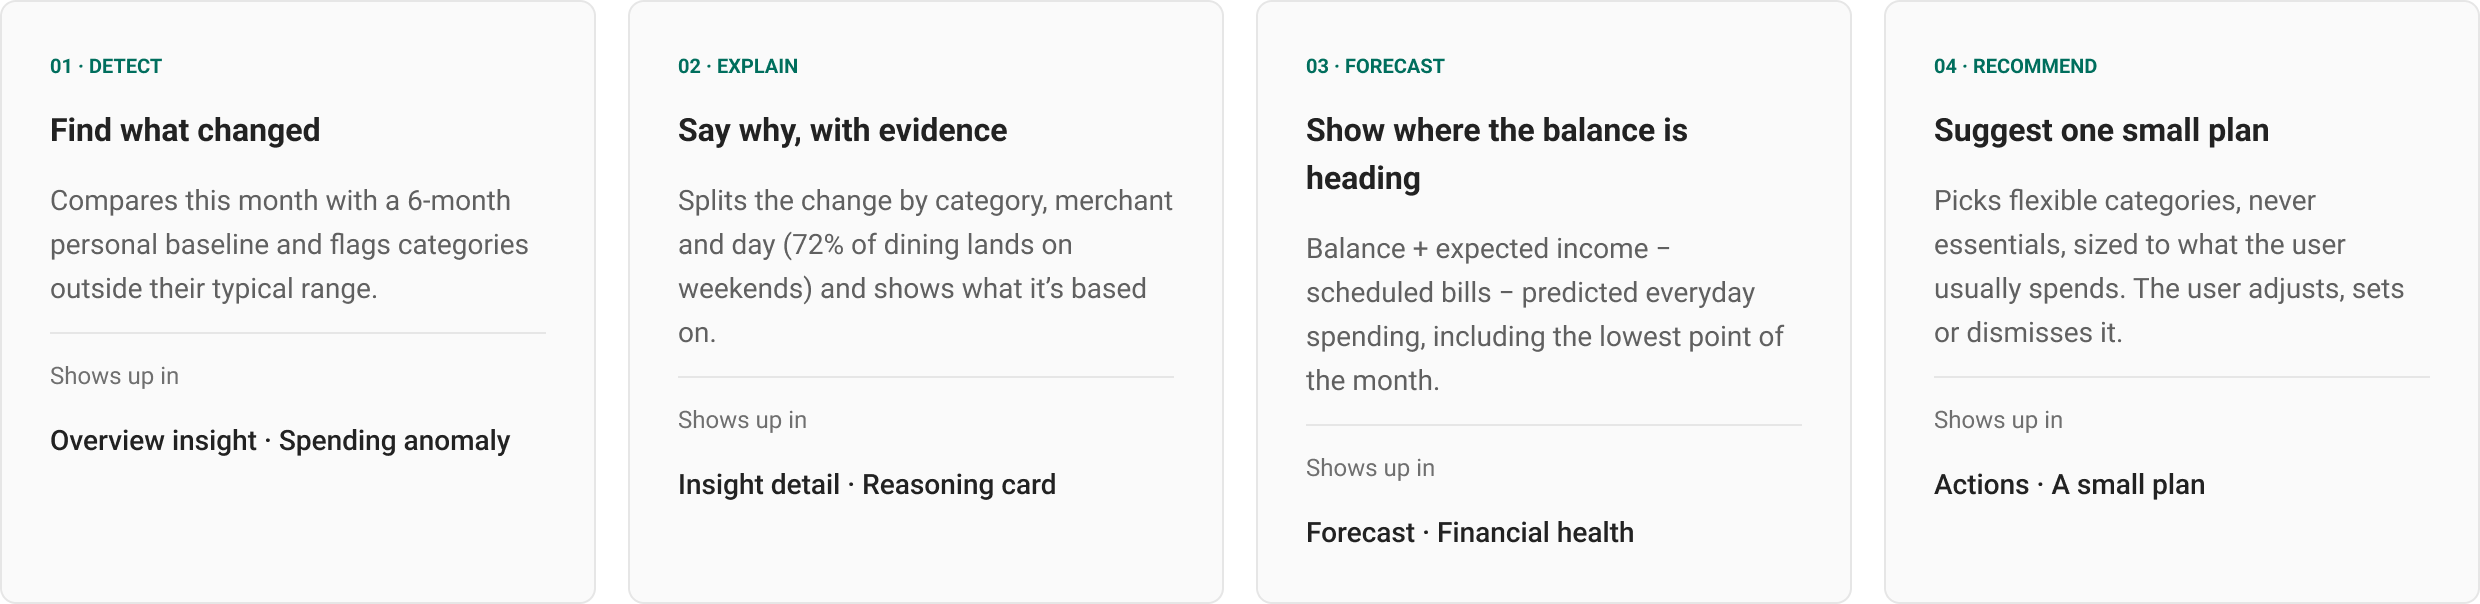
Four AI jobs: detect, explain, forecast, recommend
Recommendation + Reason + Trade-off
Trust guardrails for AI that touches money
Primary journey in five steps
d. Review, Iterate & Validate
Cognitive walkthrough + heuristic evaluation of my own design
Prioritized findings and a v2 with before/after
Primary metric, guardrails and event plan
Usability test and A/B test plan
2. Problem & Opportunity
The brief was broad: use AI to help people make smarter everyday money decisions. Before designing screens, I mapped where people get stuck with money, then chose one problem to solve deeply instead of designing a full finance app.
Why current banking apps fall short
Data, not meaning. Today’s apps show the total, the period and a category breakdown. The user still has to work out what changed and why.
Generic, not personal. Budgets compare spending with a limit set once, not with the user’s own normal month.
Backward-looking. Totals describe the past. Nothing says where the balance is heading after upcoming bills.
No next step. Even when something looks off, the decision and the math are left to the user.
Six everyday money problems
I wrote each problem as a real moment, with an example and what AI could do that a static screen can’t.
Choosing one problem to solve deeply
I scored each problem on user impact, how often the moment happens, how much AI adds over a static screen, and whether it fits one end-to-end flow.
One loop, not six features
I connected P1, P5 and P4 into one journey: notice a change, understand the habit behind it, and commit to a small plan. The other problems reuse the same engine later, so the first version stays focused.
3. AI Interaction Model & User Flow
AI is part of the screens, not a separate chat. The user never has to know what to ask: the app surfaces one explained insight at a time, and every insight ends in one next step.
Four jobs the AI does
Each job has a clear input, a clear output and a fixed place in the UI, so AI behaviour is predictable instead of magical.
Design principles for AI that touches money
Recommendation + Reason + Trade-off
Every recommendation follows the same structure, so users learn to read it once. The user always decides: set the goal, adjust it, or say Not now.
Primary user journey
Five steps from noticing a change to tracking a plan. Users can enter at any step from the tab bar, and every screen links forward to the next.
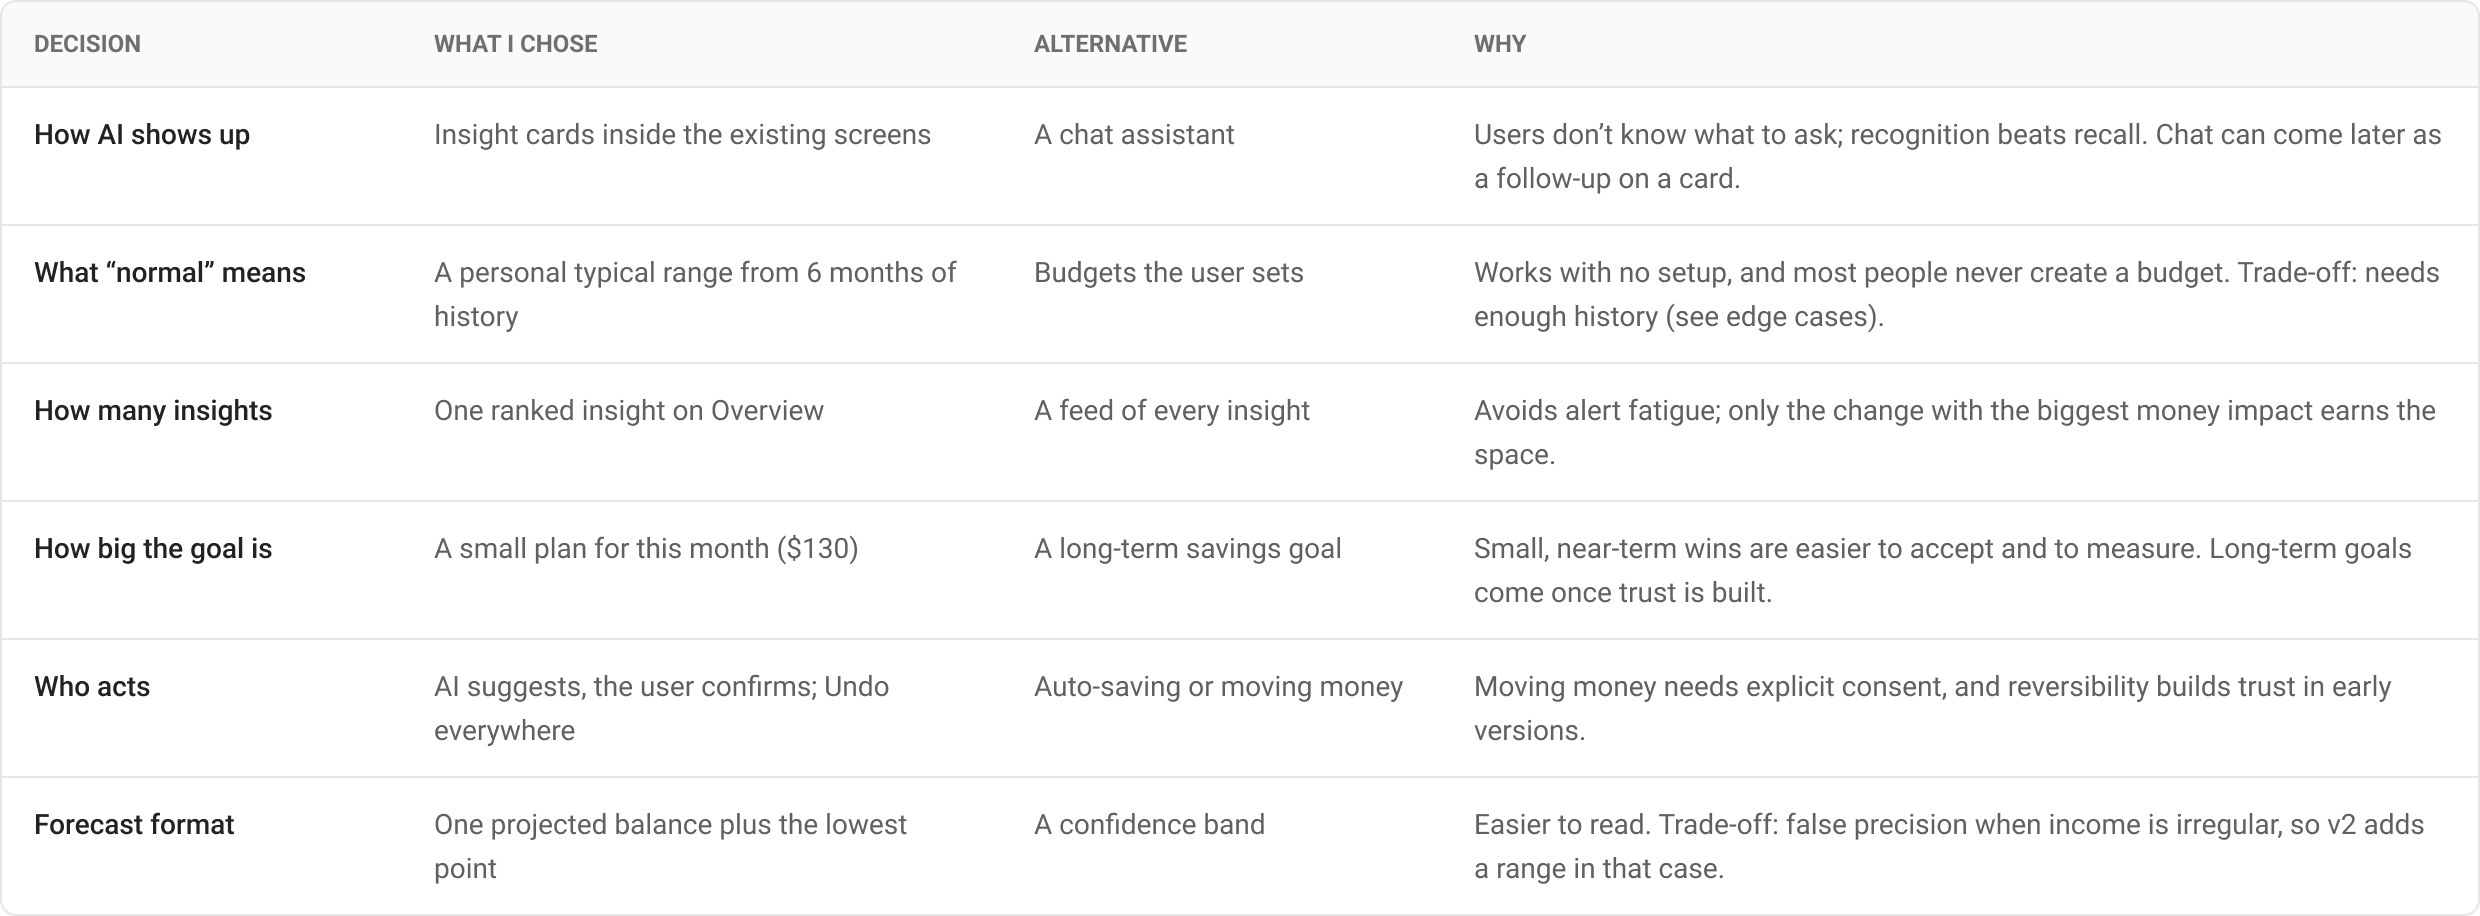
Key decisions & trade-offs
4. Final UI & Edge Cases
Fourteen full screens built around one person, Maya, in the second half of August, all wired as a clickable prototype. Each screen answers one question and ends with one next step.
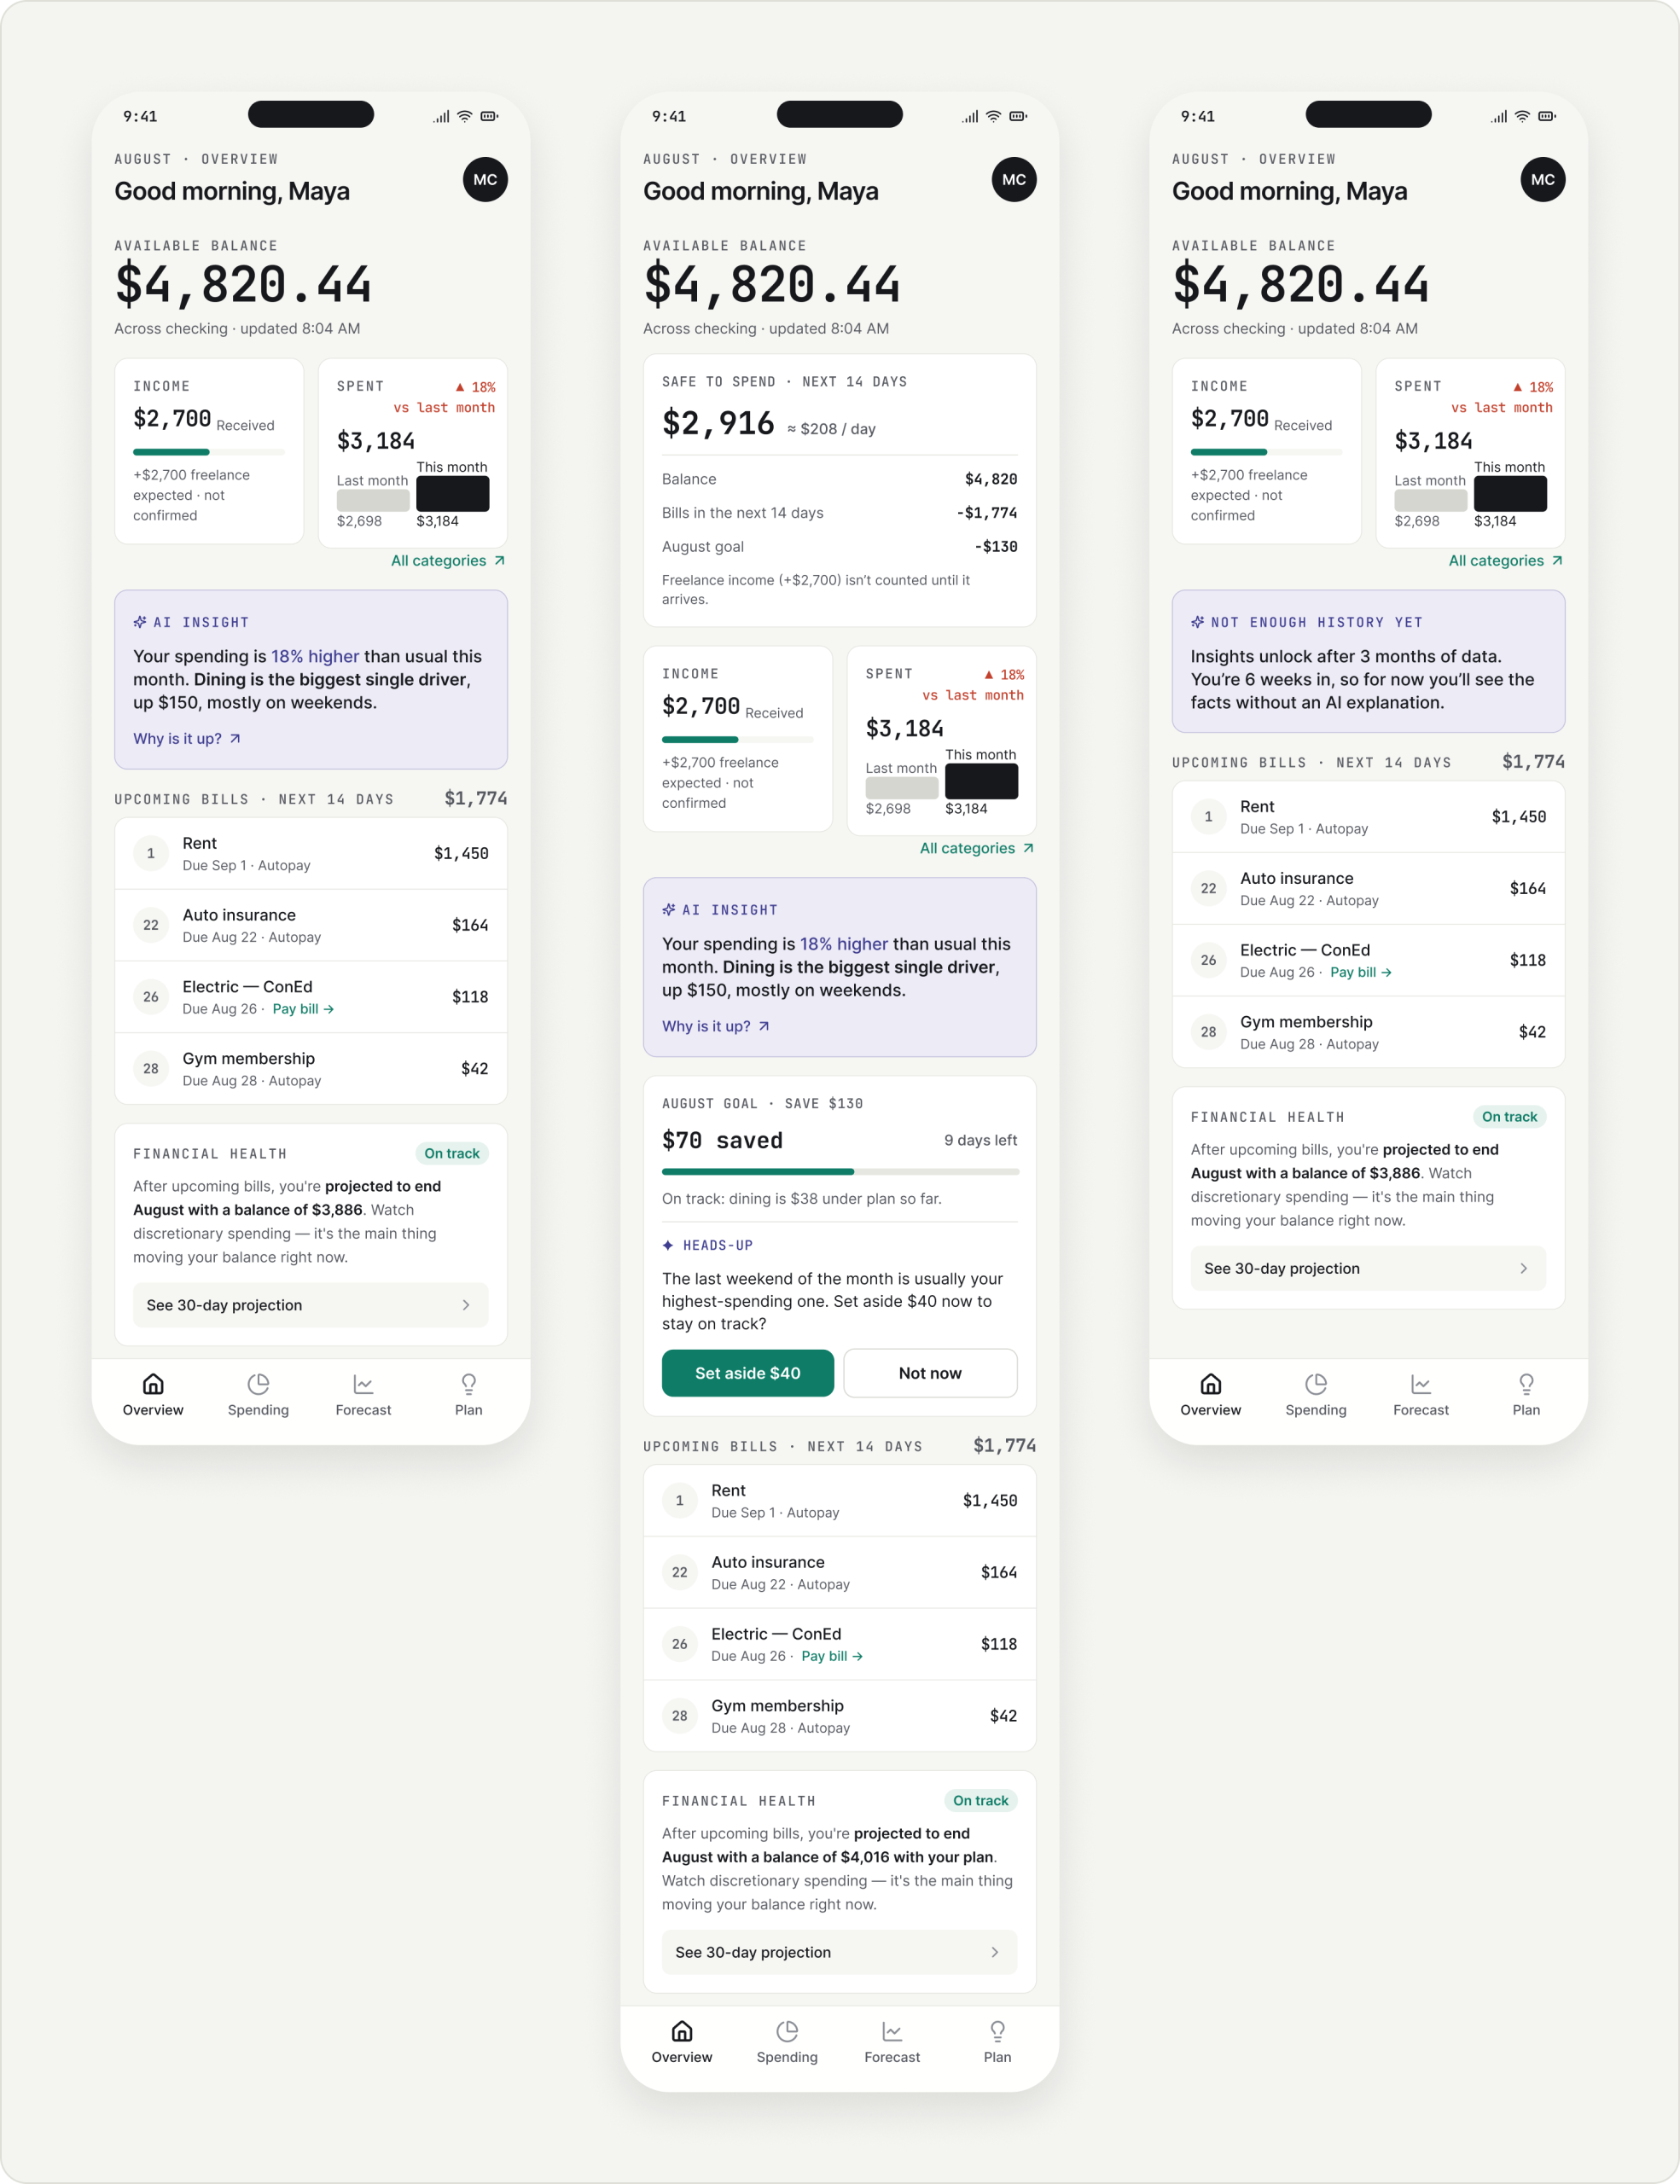
Overview · Understand my current situation
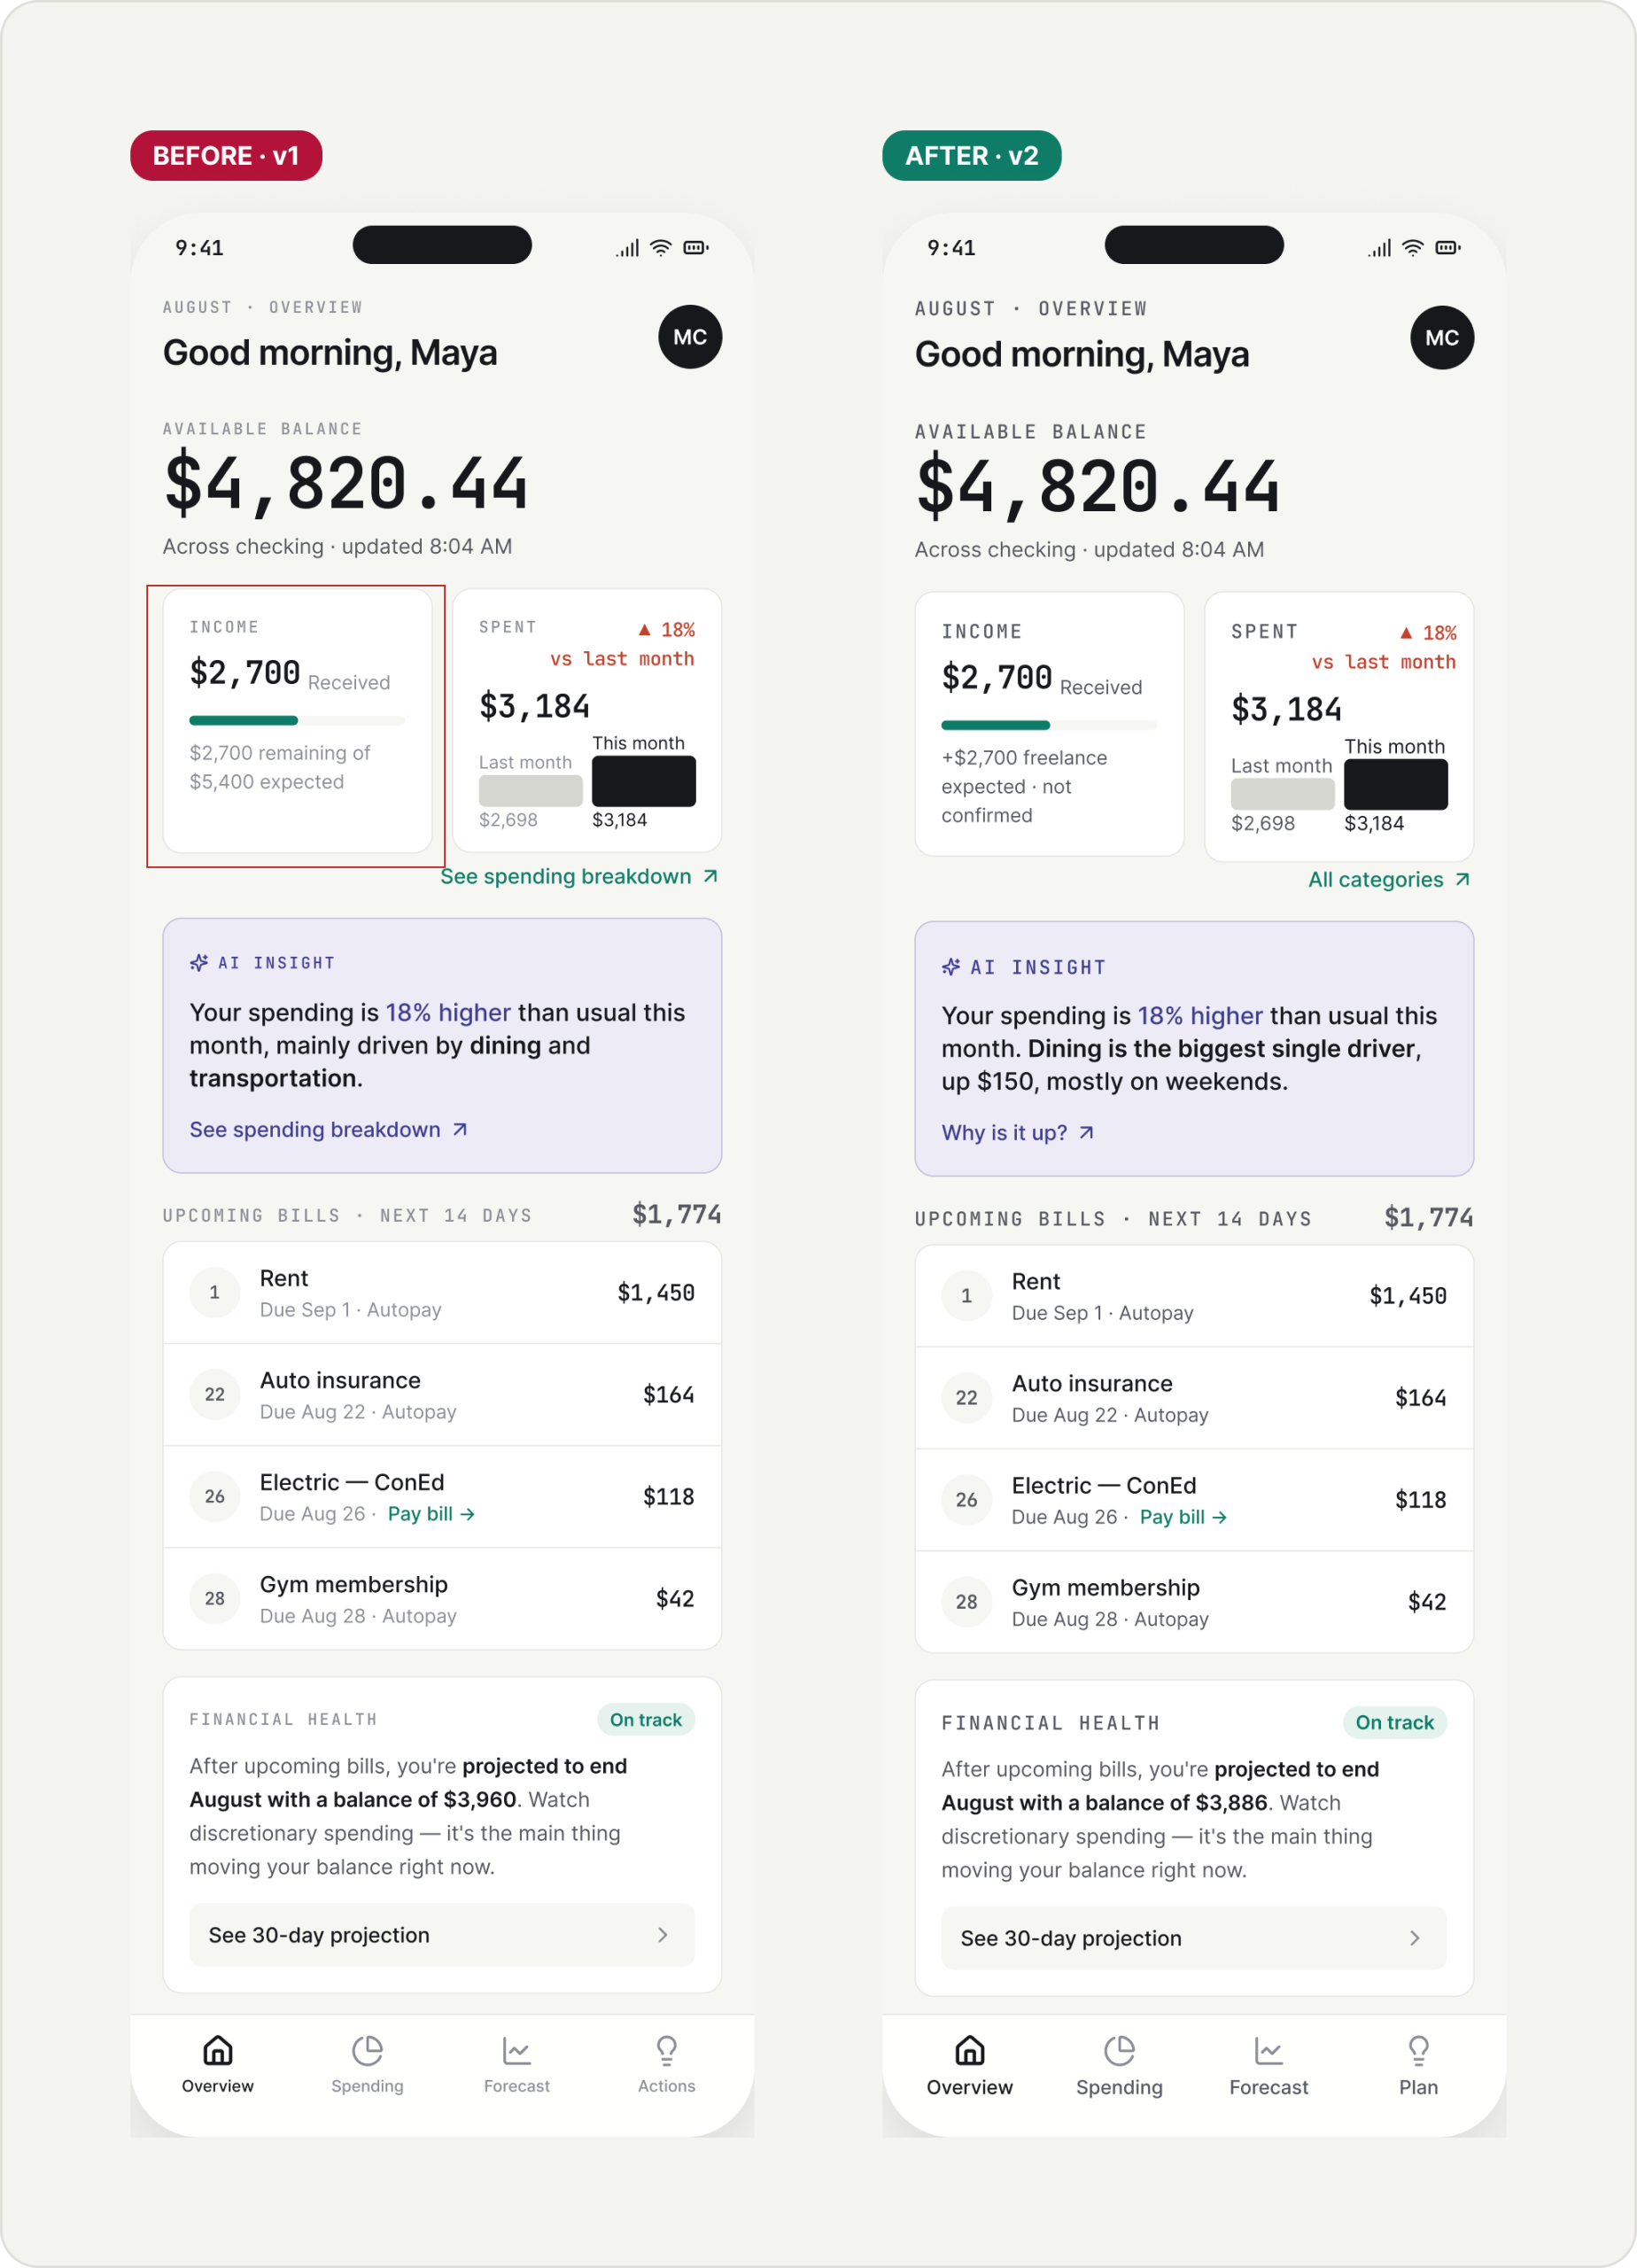
Balance with context. Income received vs expected and spending vs last month sit under the balance, so the 18% jump is visible at a glance.
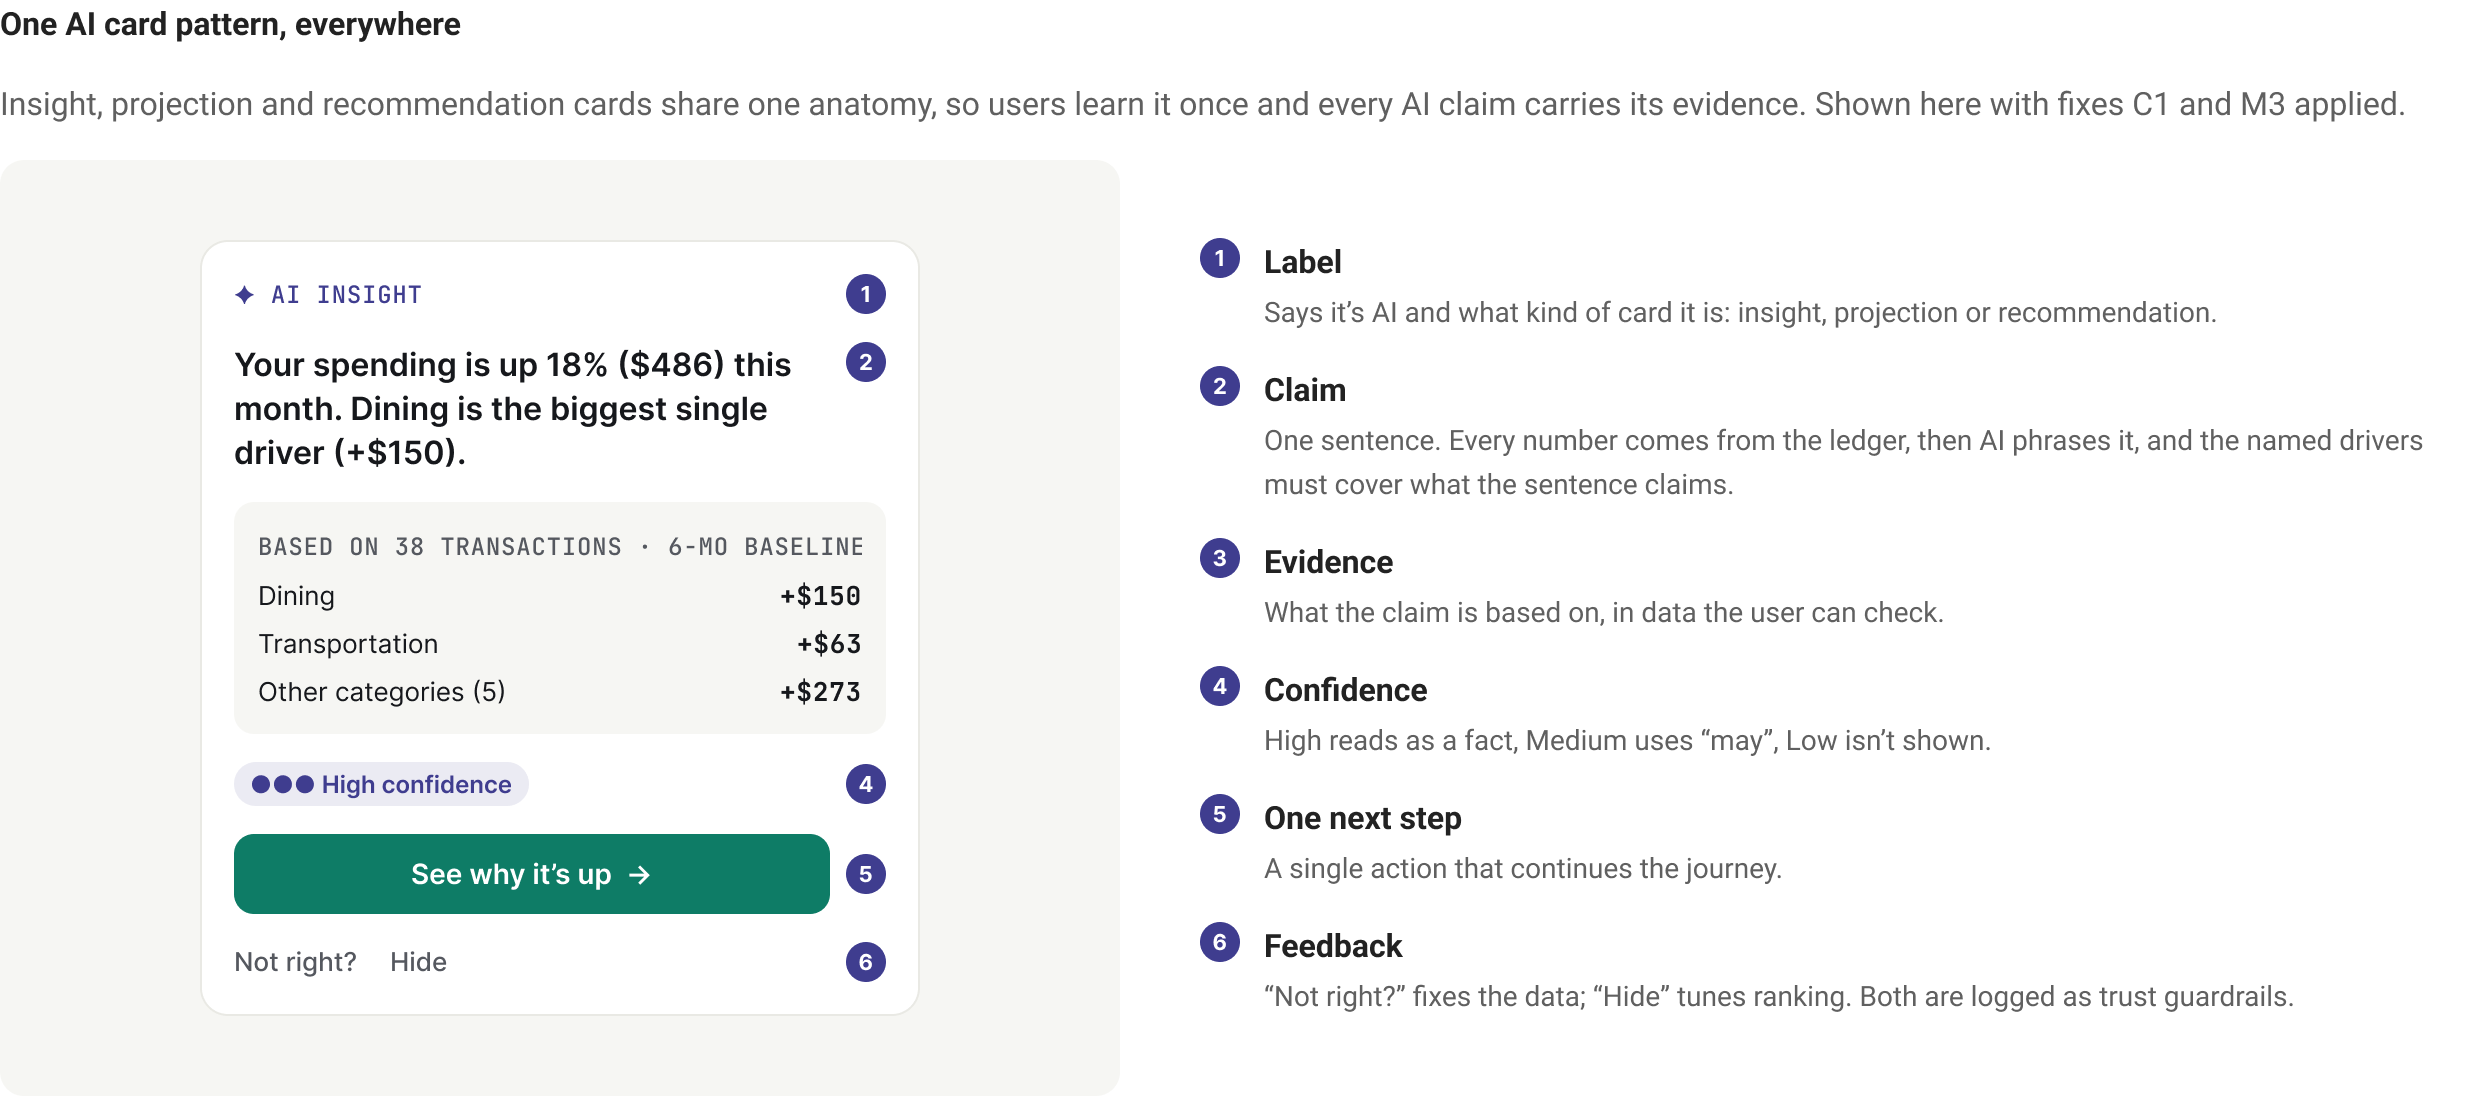
One AI insight, ranked by impact. “Dining is the biggest single driver, up $150, mostly on weekends”, with “Why is it up?” to the evidence.
Bills and month-end outlook. Upcoming bills for the next 14 days and the projected month-end balance, which links to the forecast.
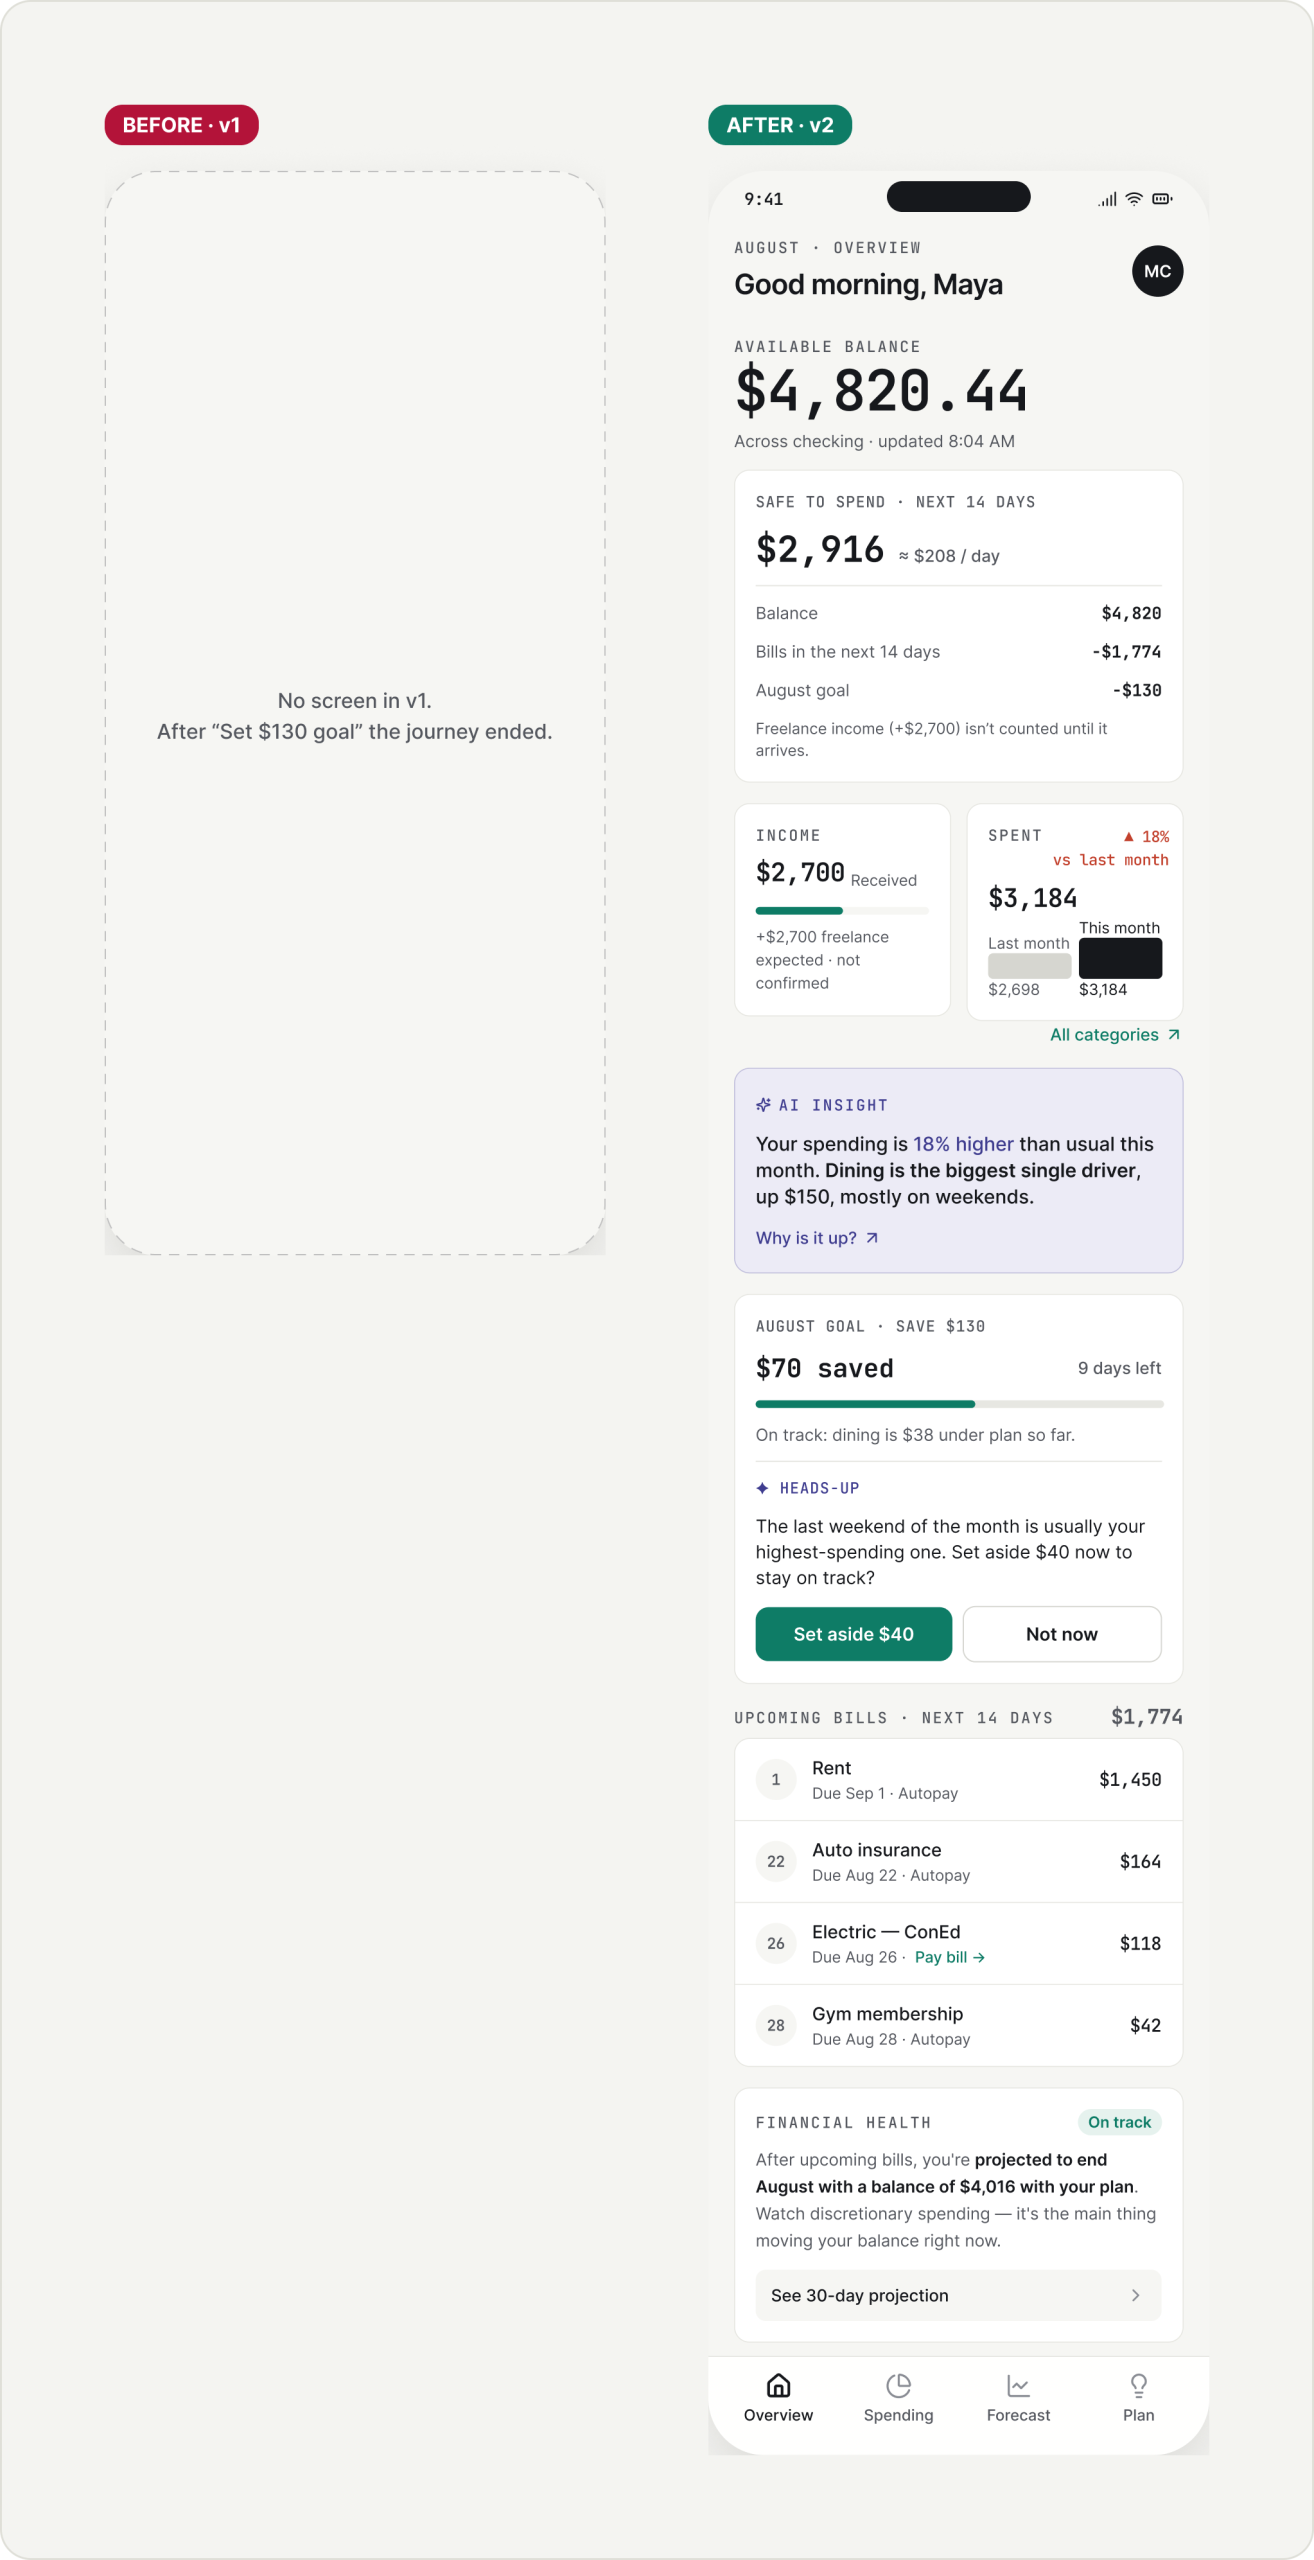
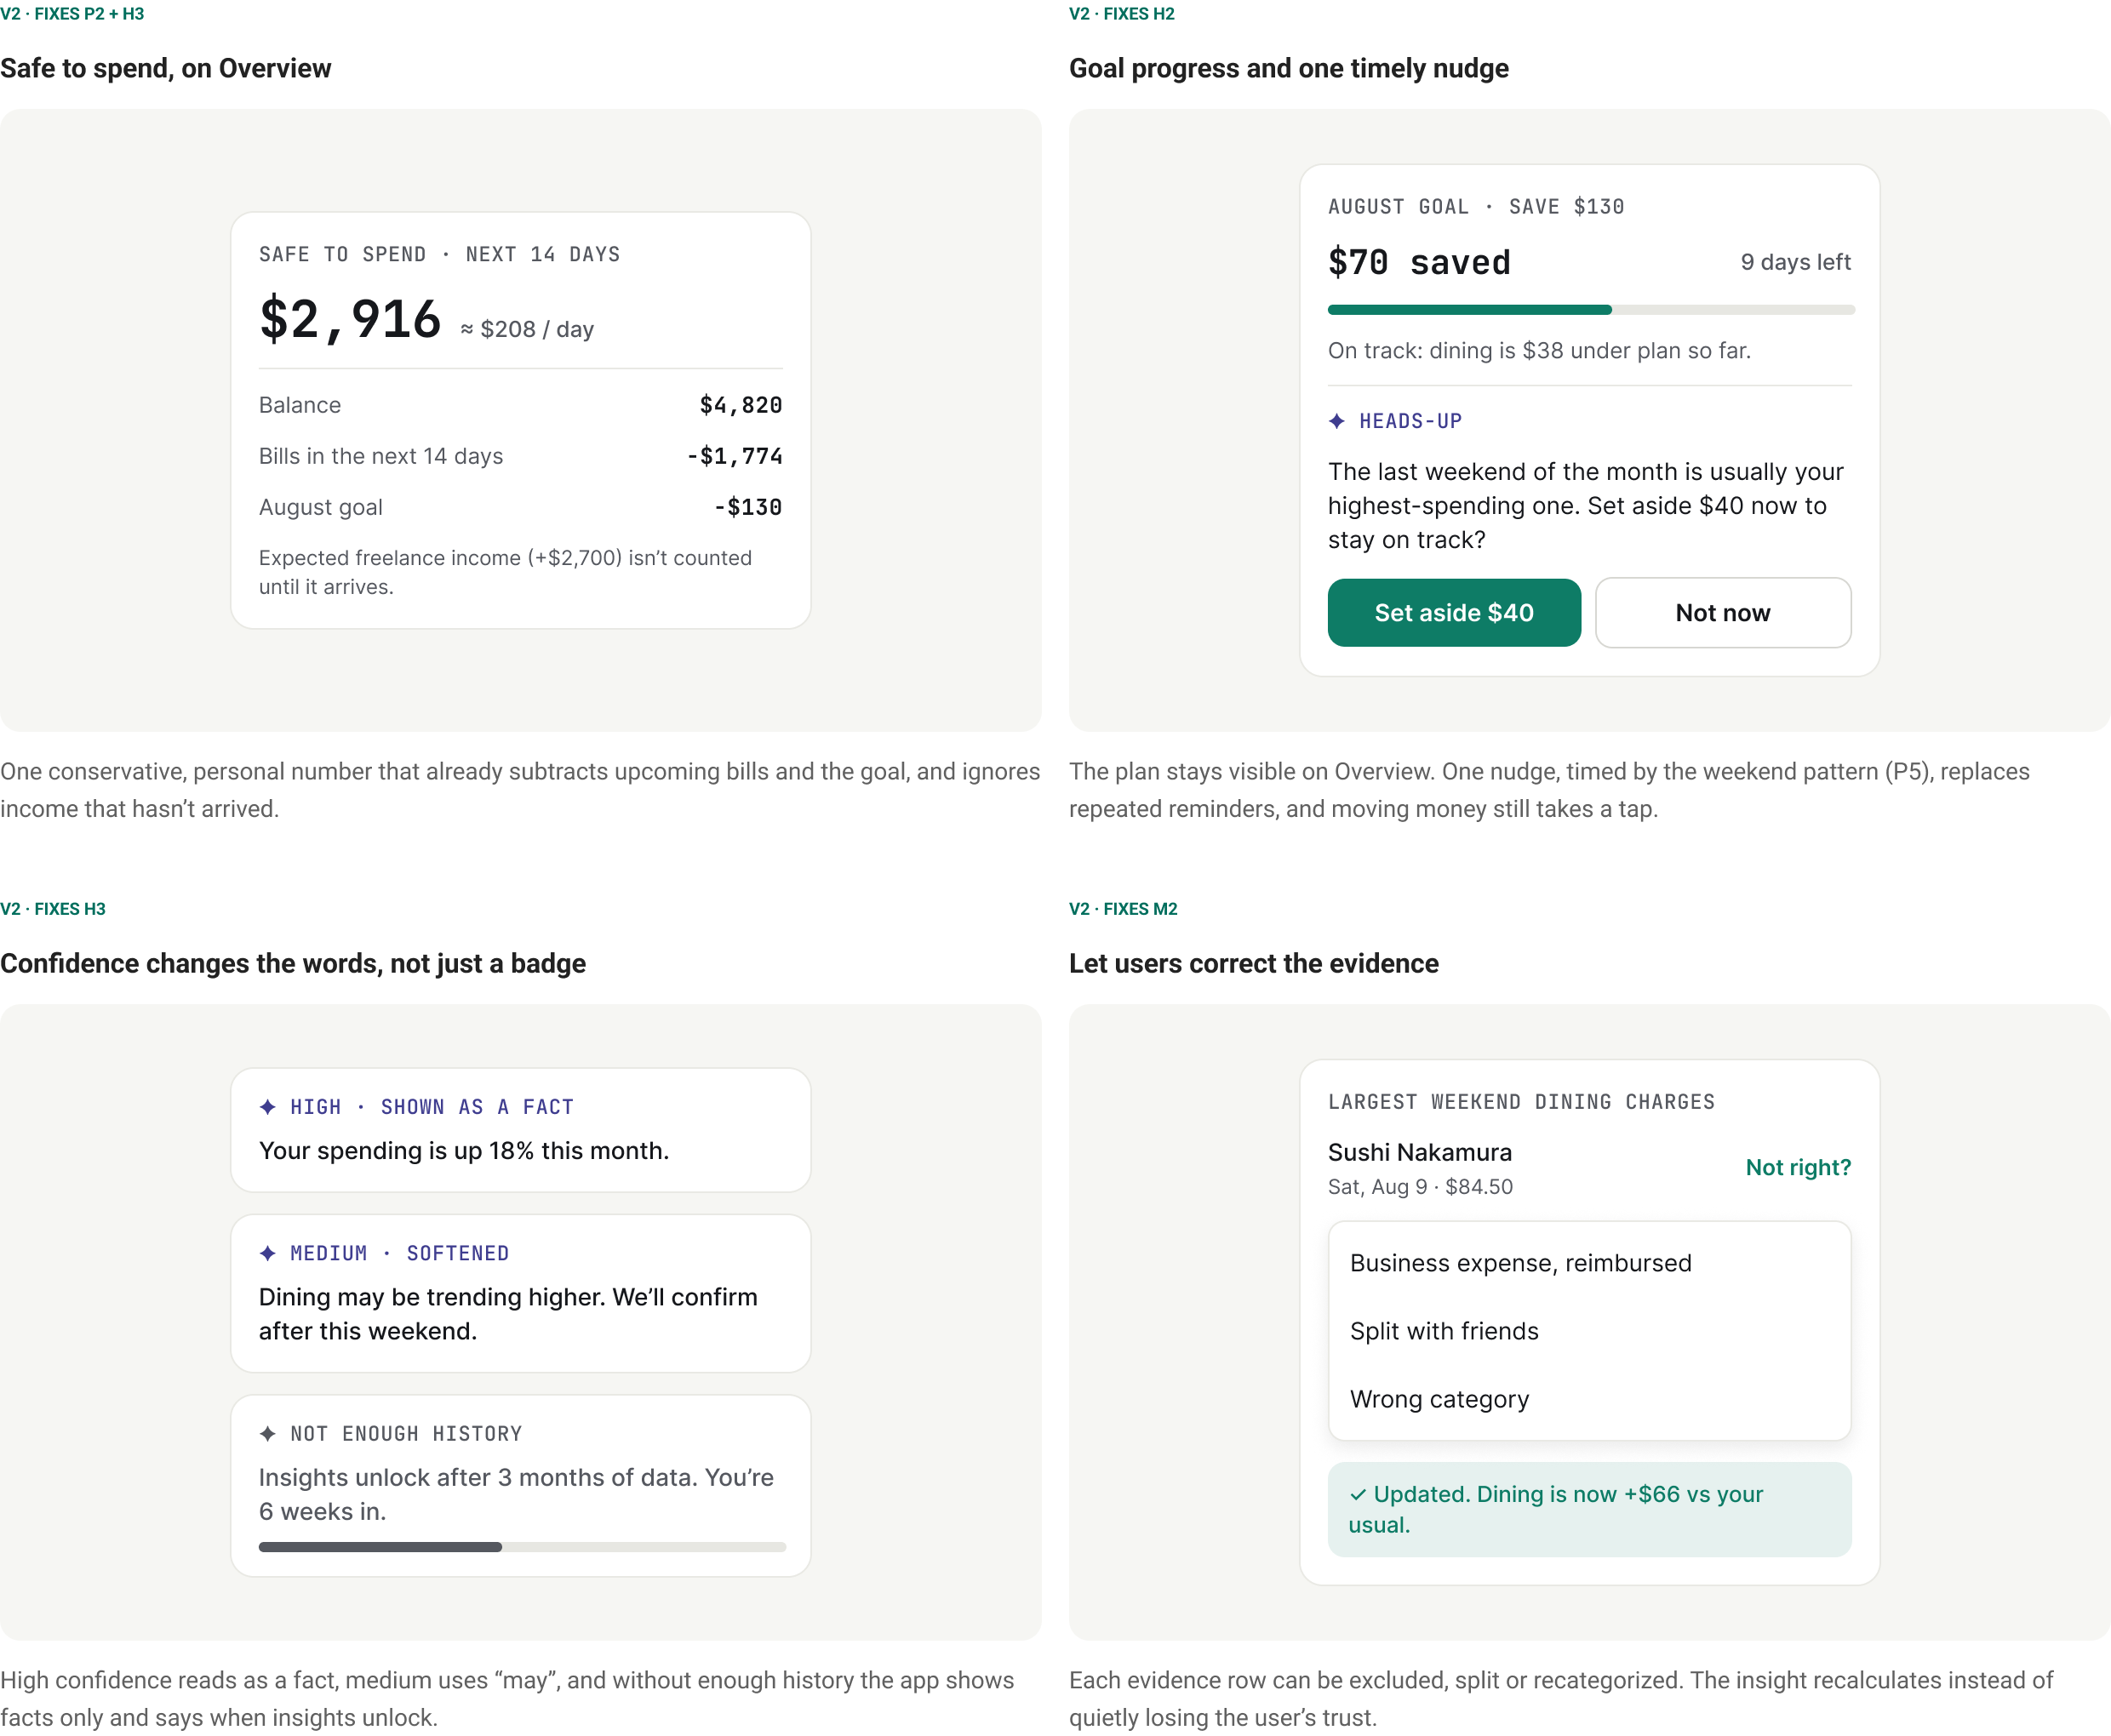
After the goal is set. The plan comes back as progress, one nudge before the riskiest weekend, and a Safe to spend number.
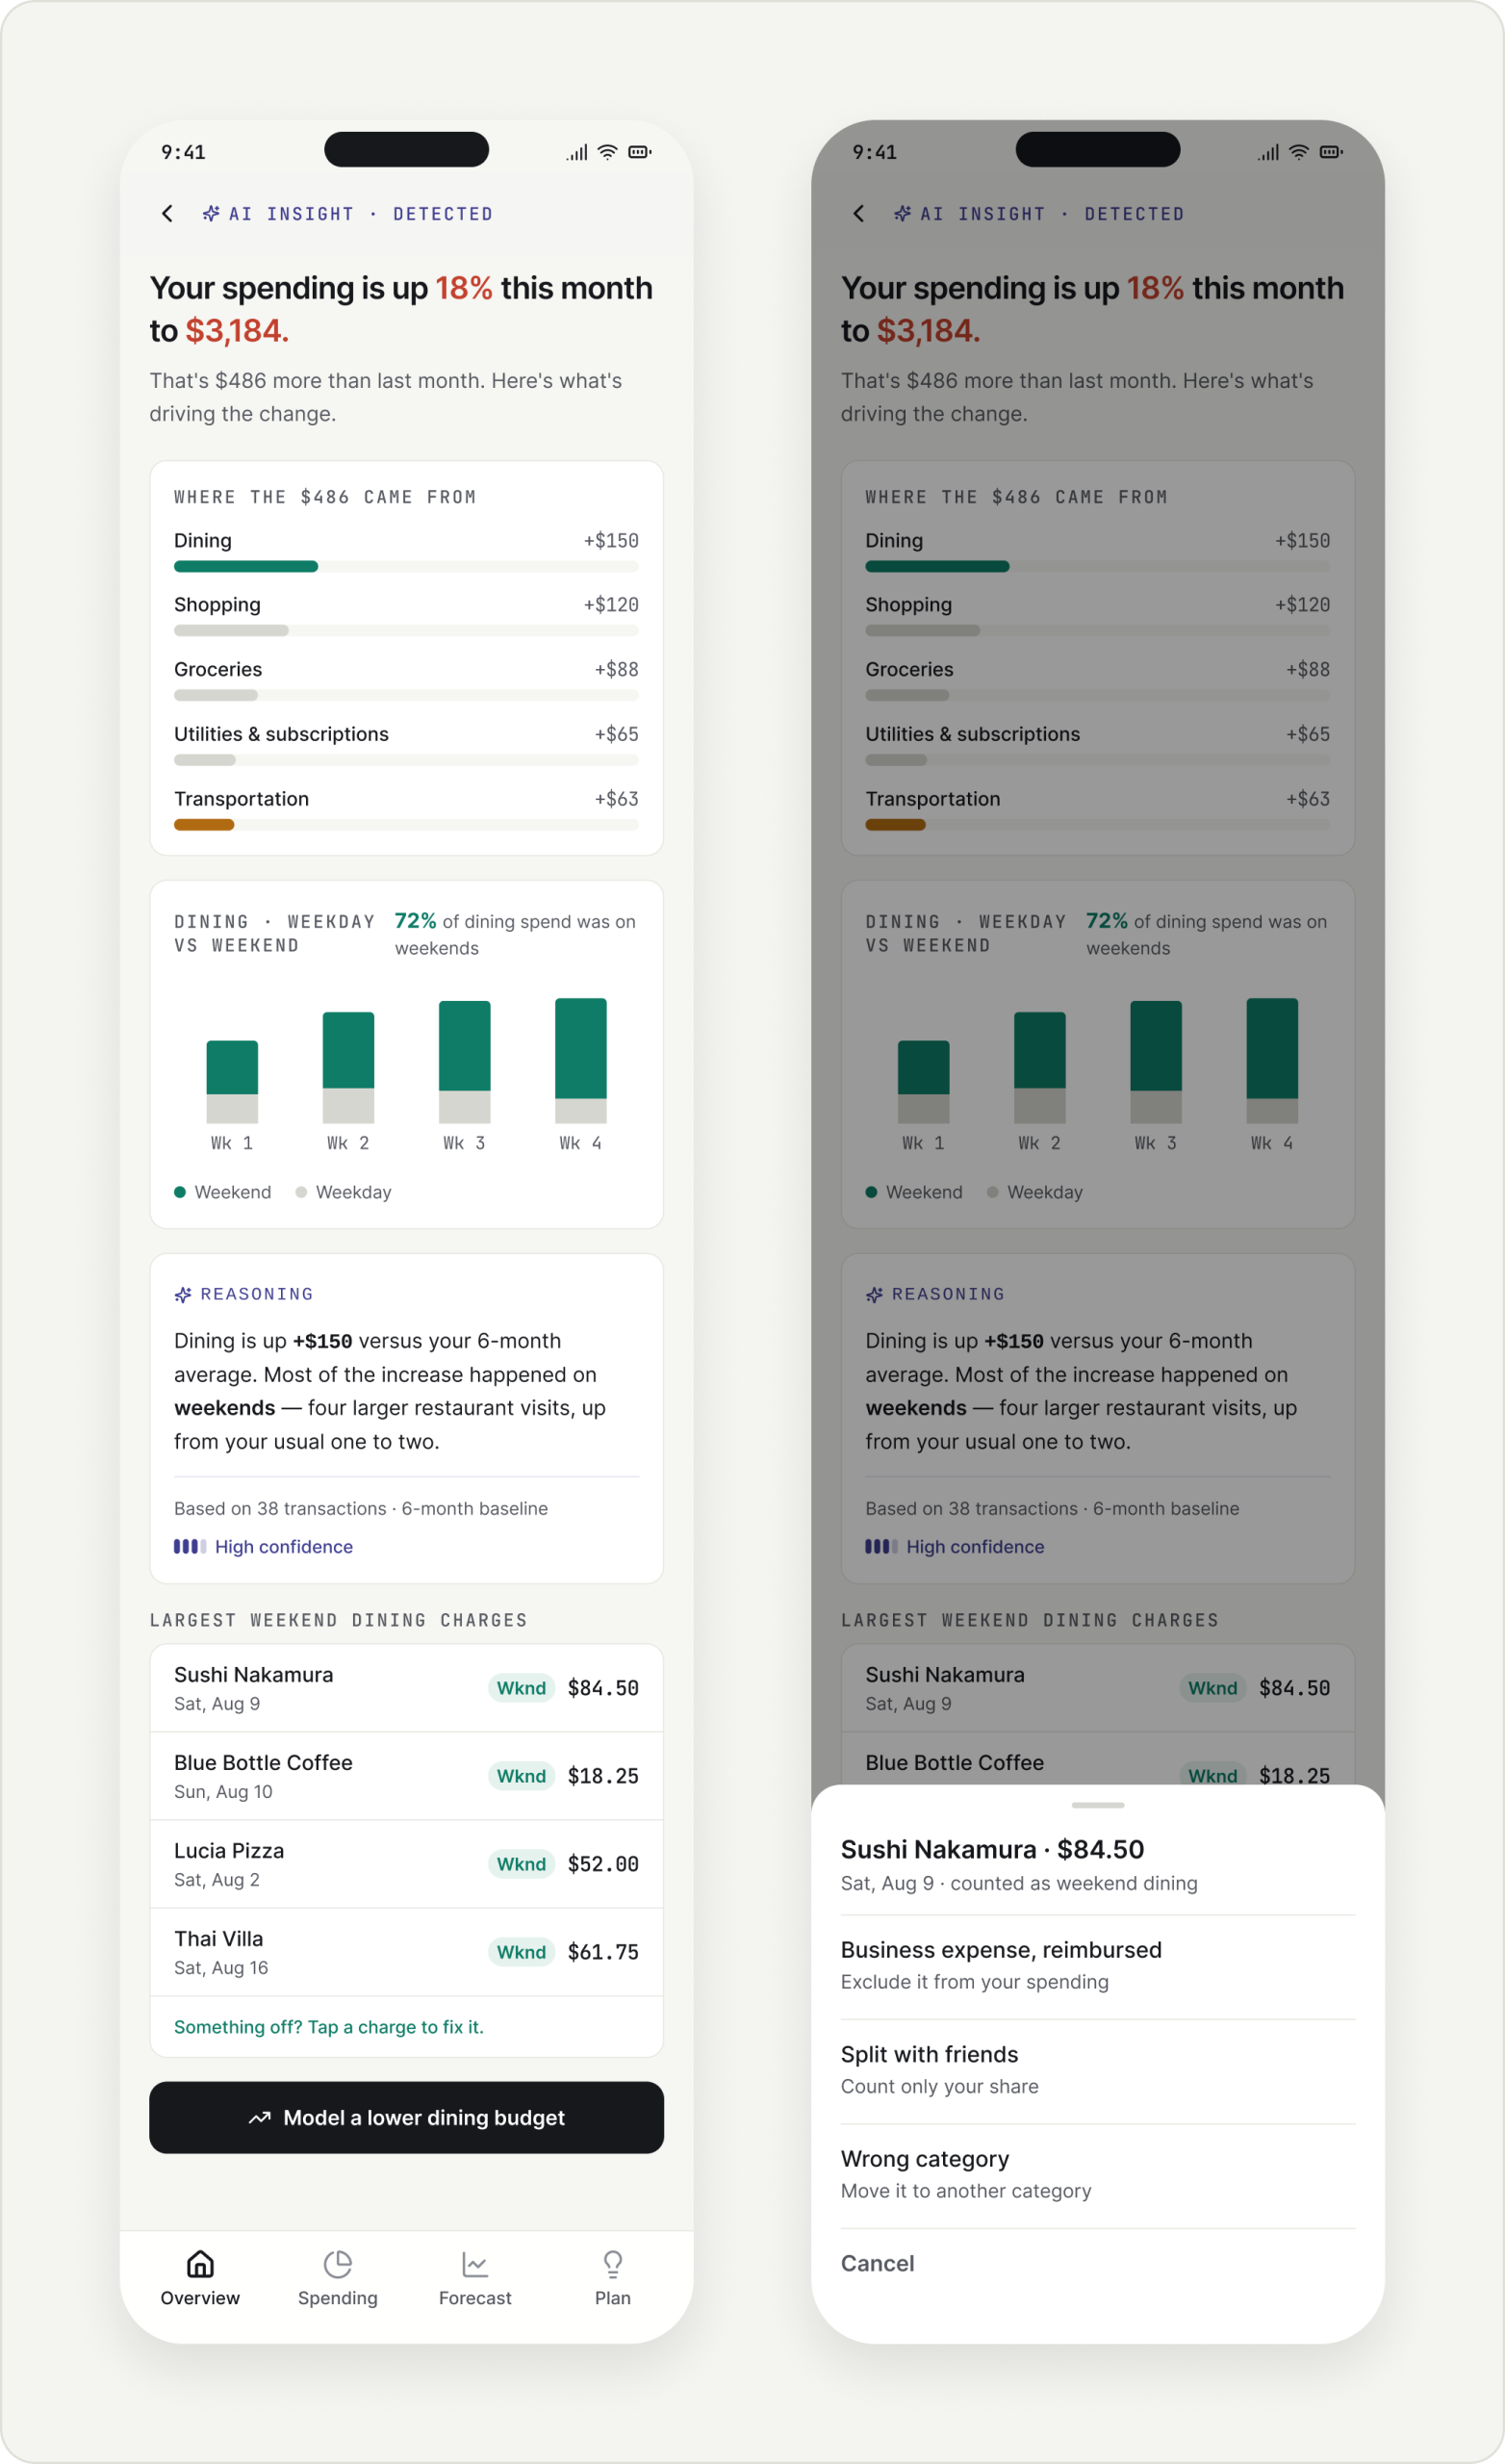
Insight detail · Why my spending is up
Where the $486 came from. The increase is split by category, so the headline can be checked.
The pattern behind it. 72% of dining spend lands on weekends.
Reasoning with its basis. Based on 38 transactions and a 6-month baseline, with a confidence level.
Correct the evidence. Tap a charge to exclude, split or recategorize it, and the insight recalculates.
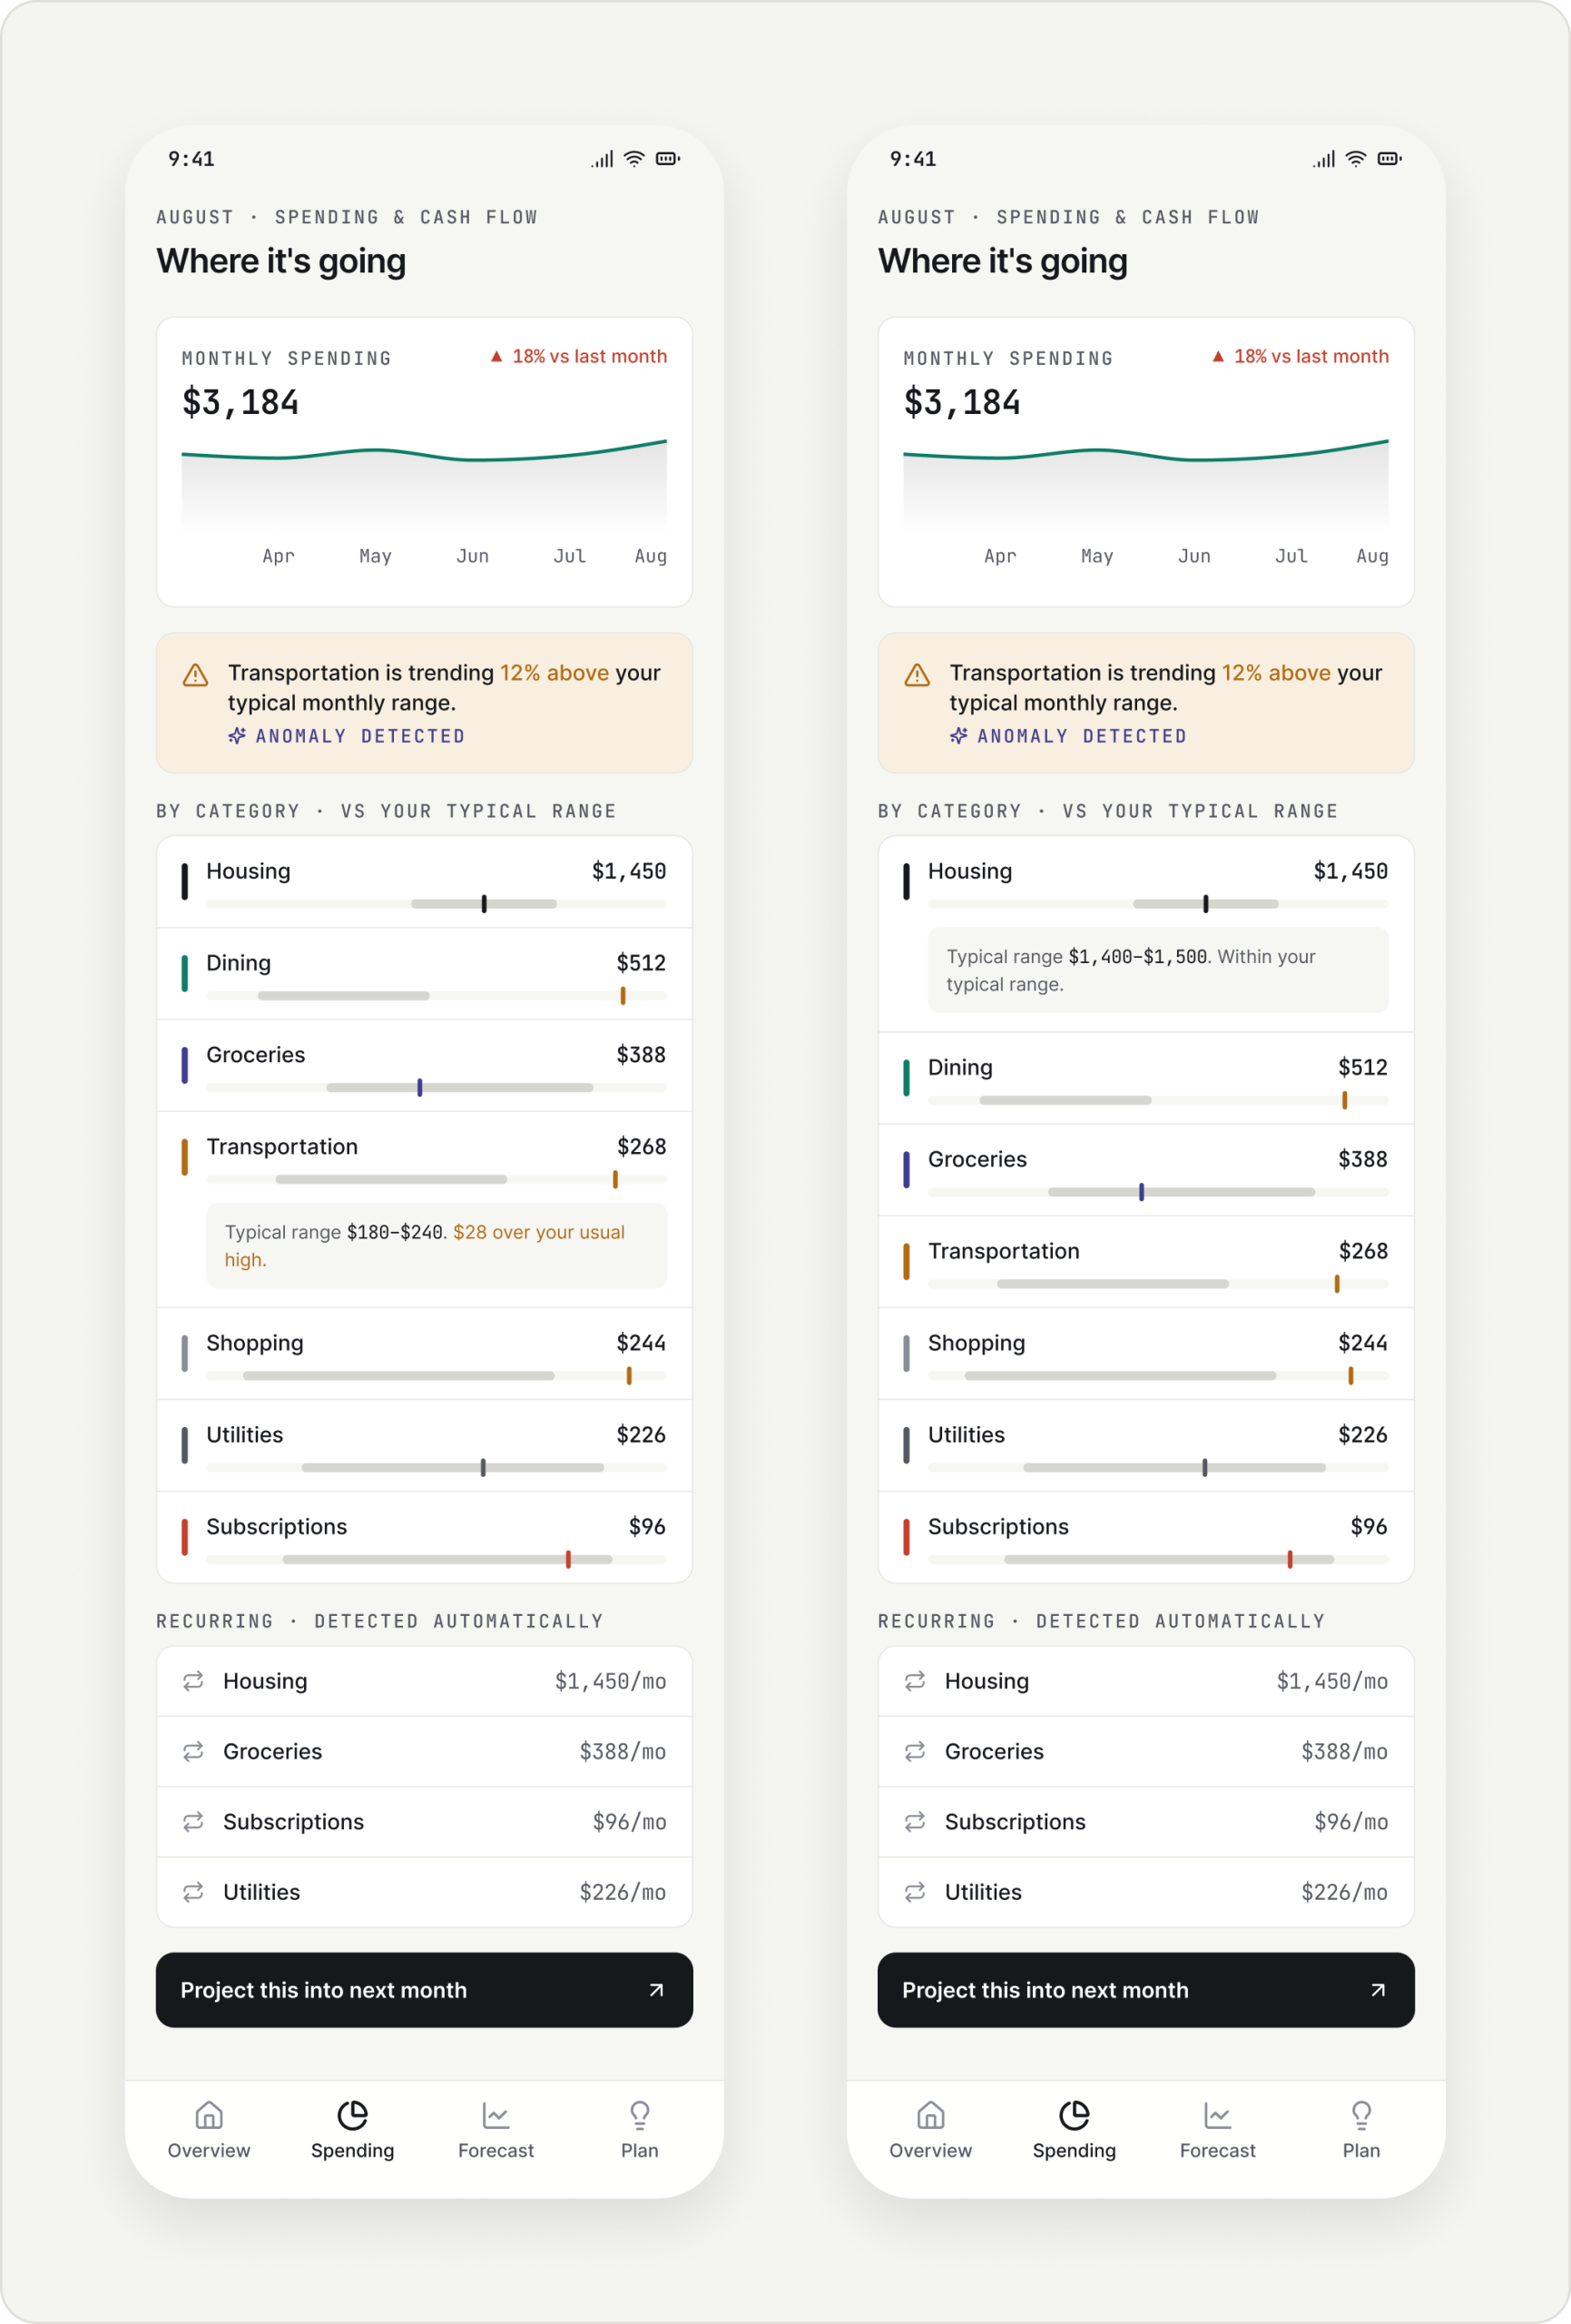
Spending · Where my money is going
Your range, not a budget. Each category shows this month against the user’s typical range.
Anomaly first. Transportation is above its range, so it’s flagged and expanded by default; one row is open at a time.
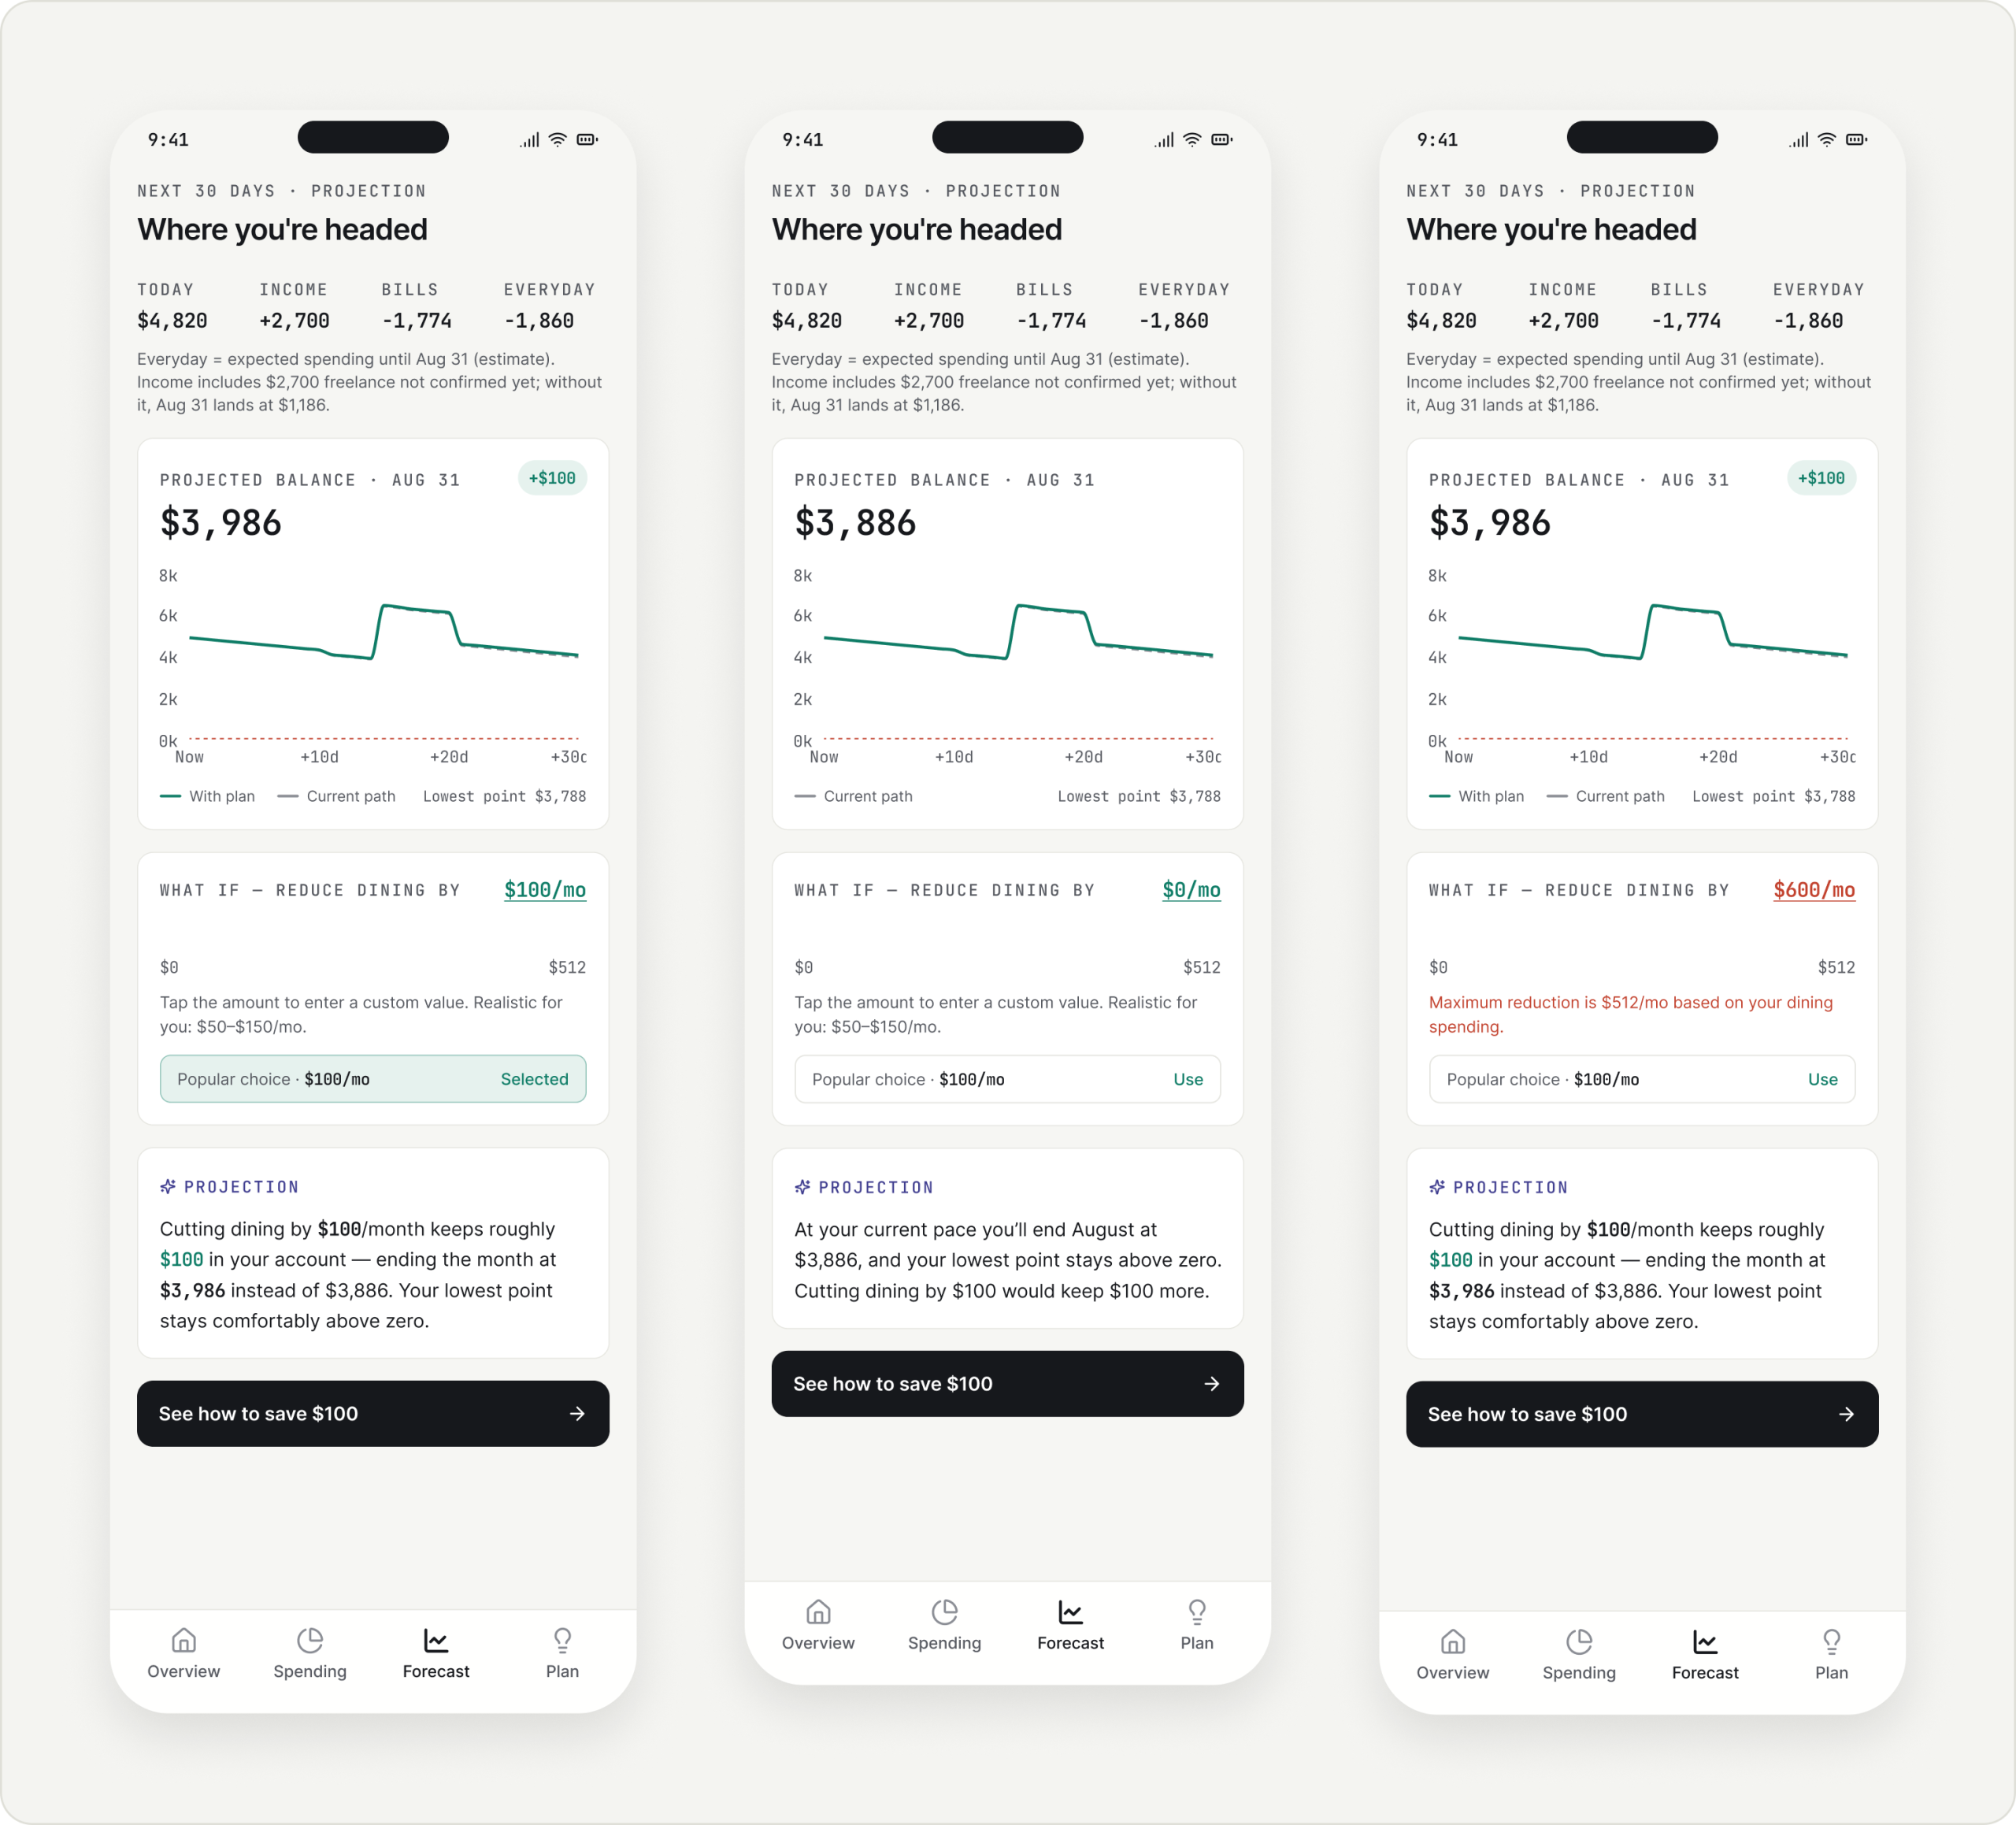
Forecast · Where my balance is heading
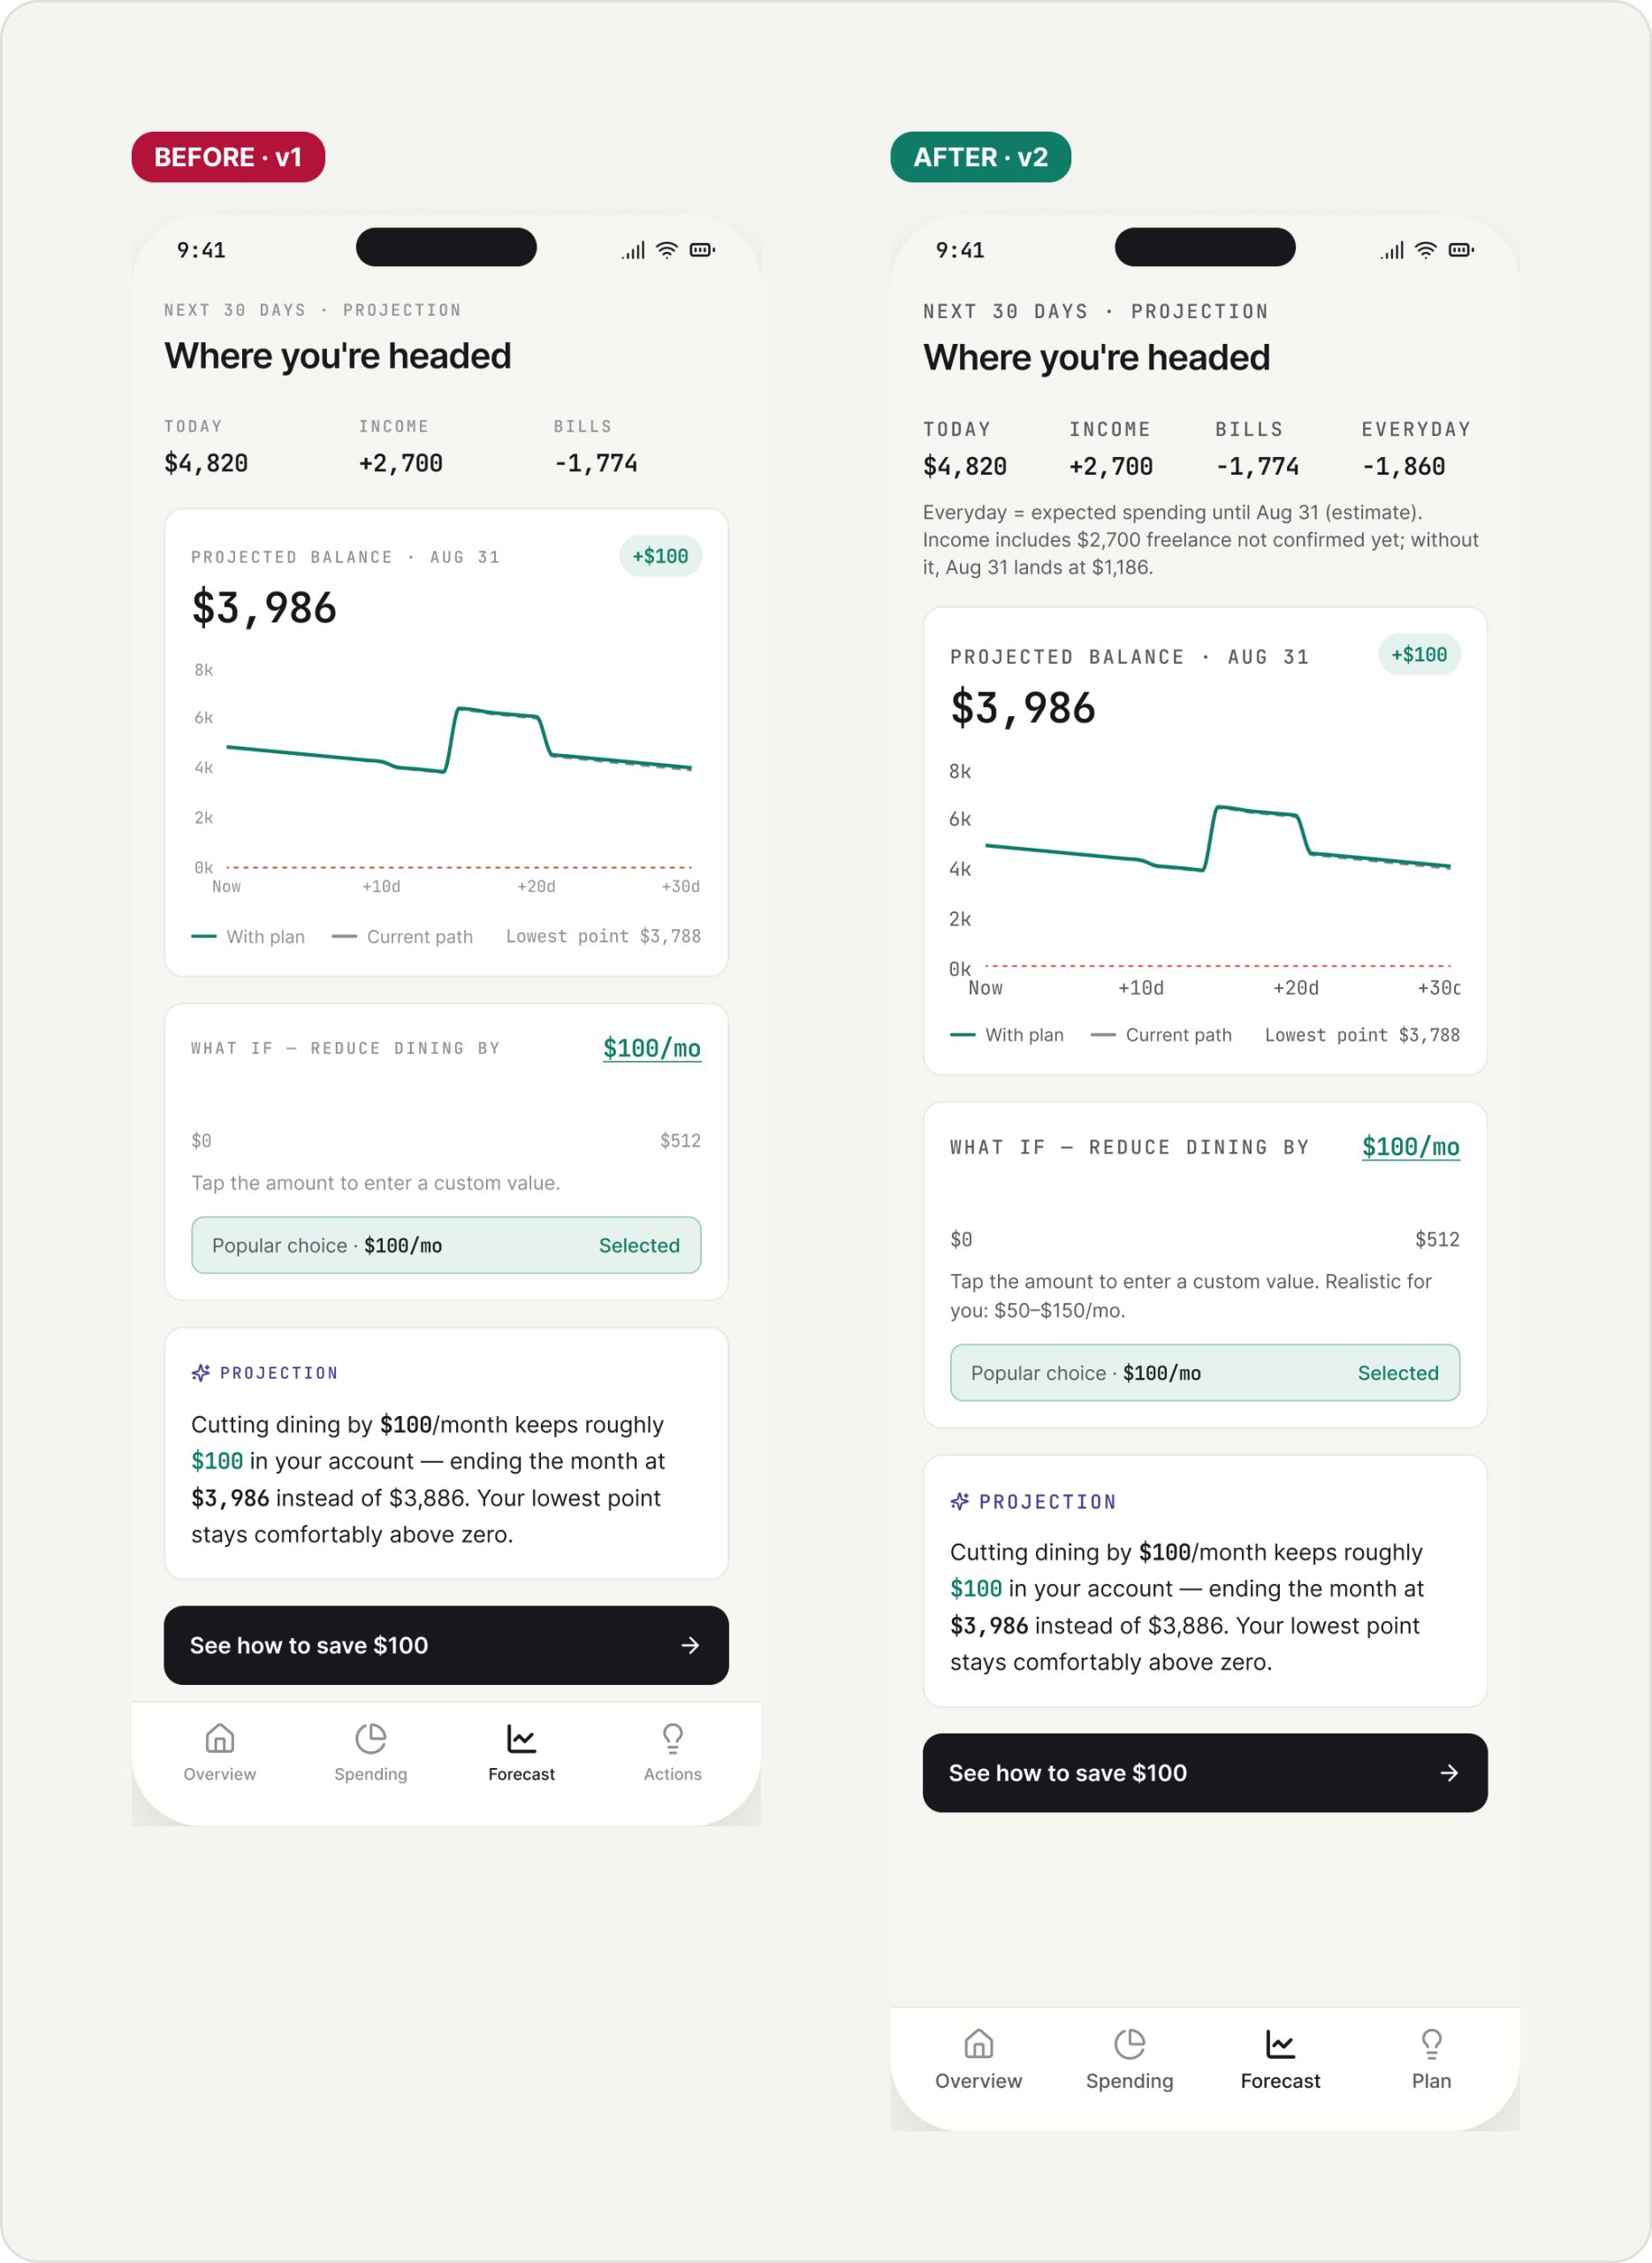
Math you can follow. Today + income − bills − everyday spending adds up to the projected balance, with the lowest point of the month.
What if I reduce dining? A suggested amount, a custom amount, and clear validation when the input is out of range.
Honest about income. Freelance income that hasn’t arrived is labelled, with where the month lands without it.
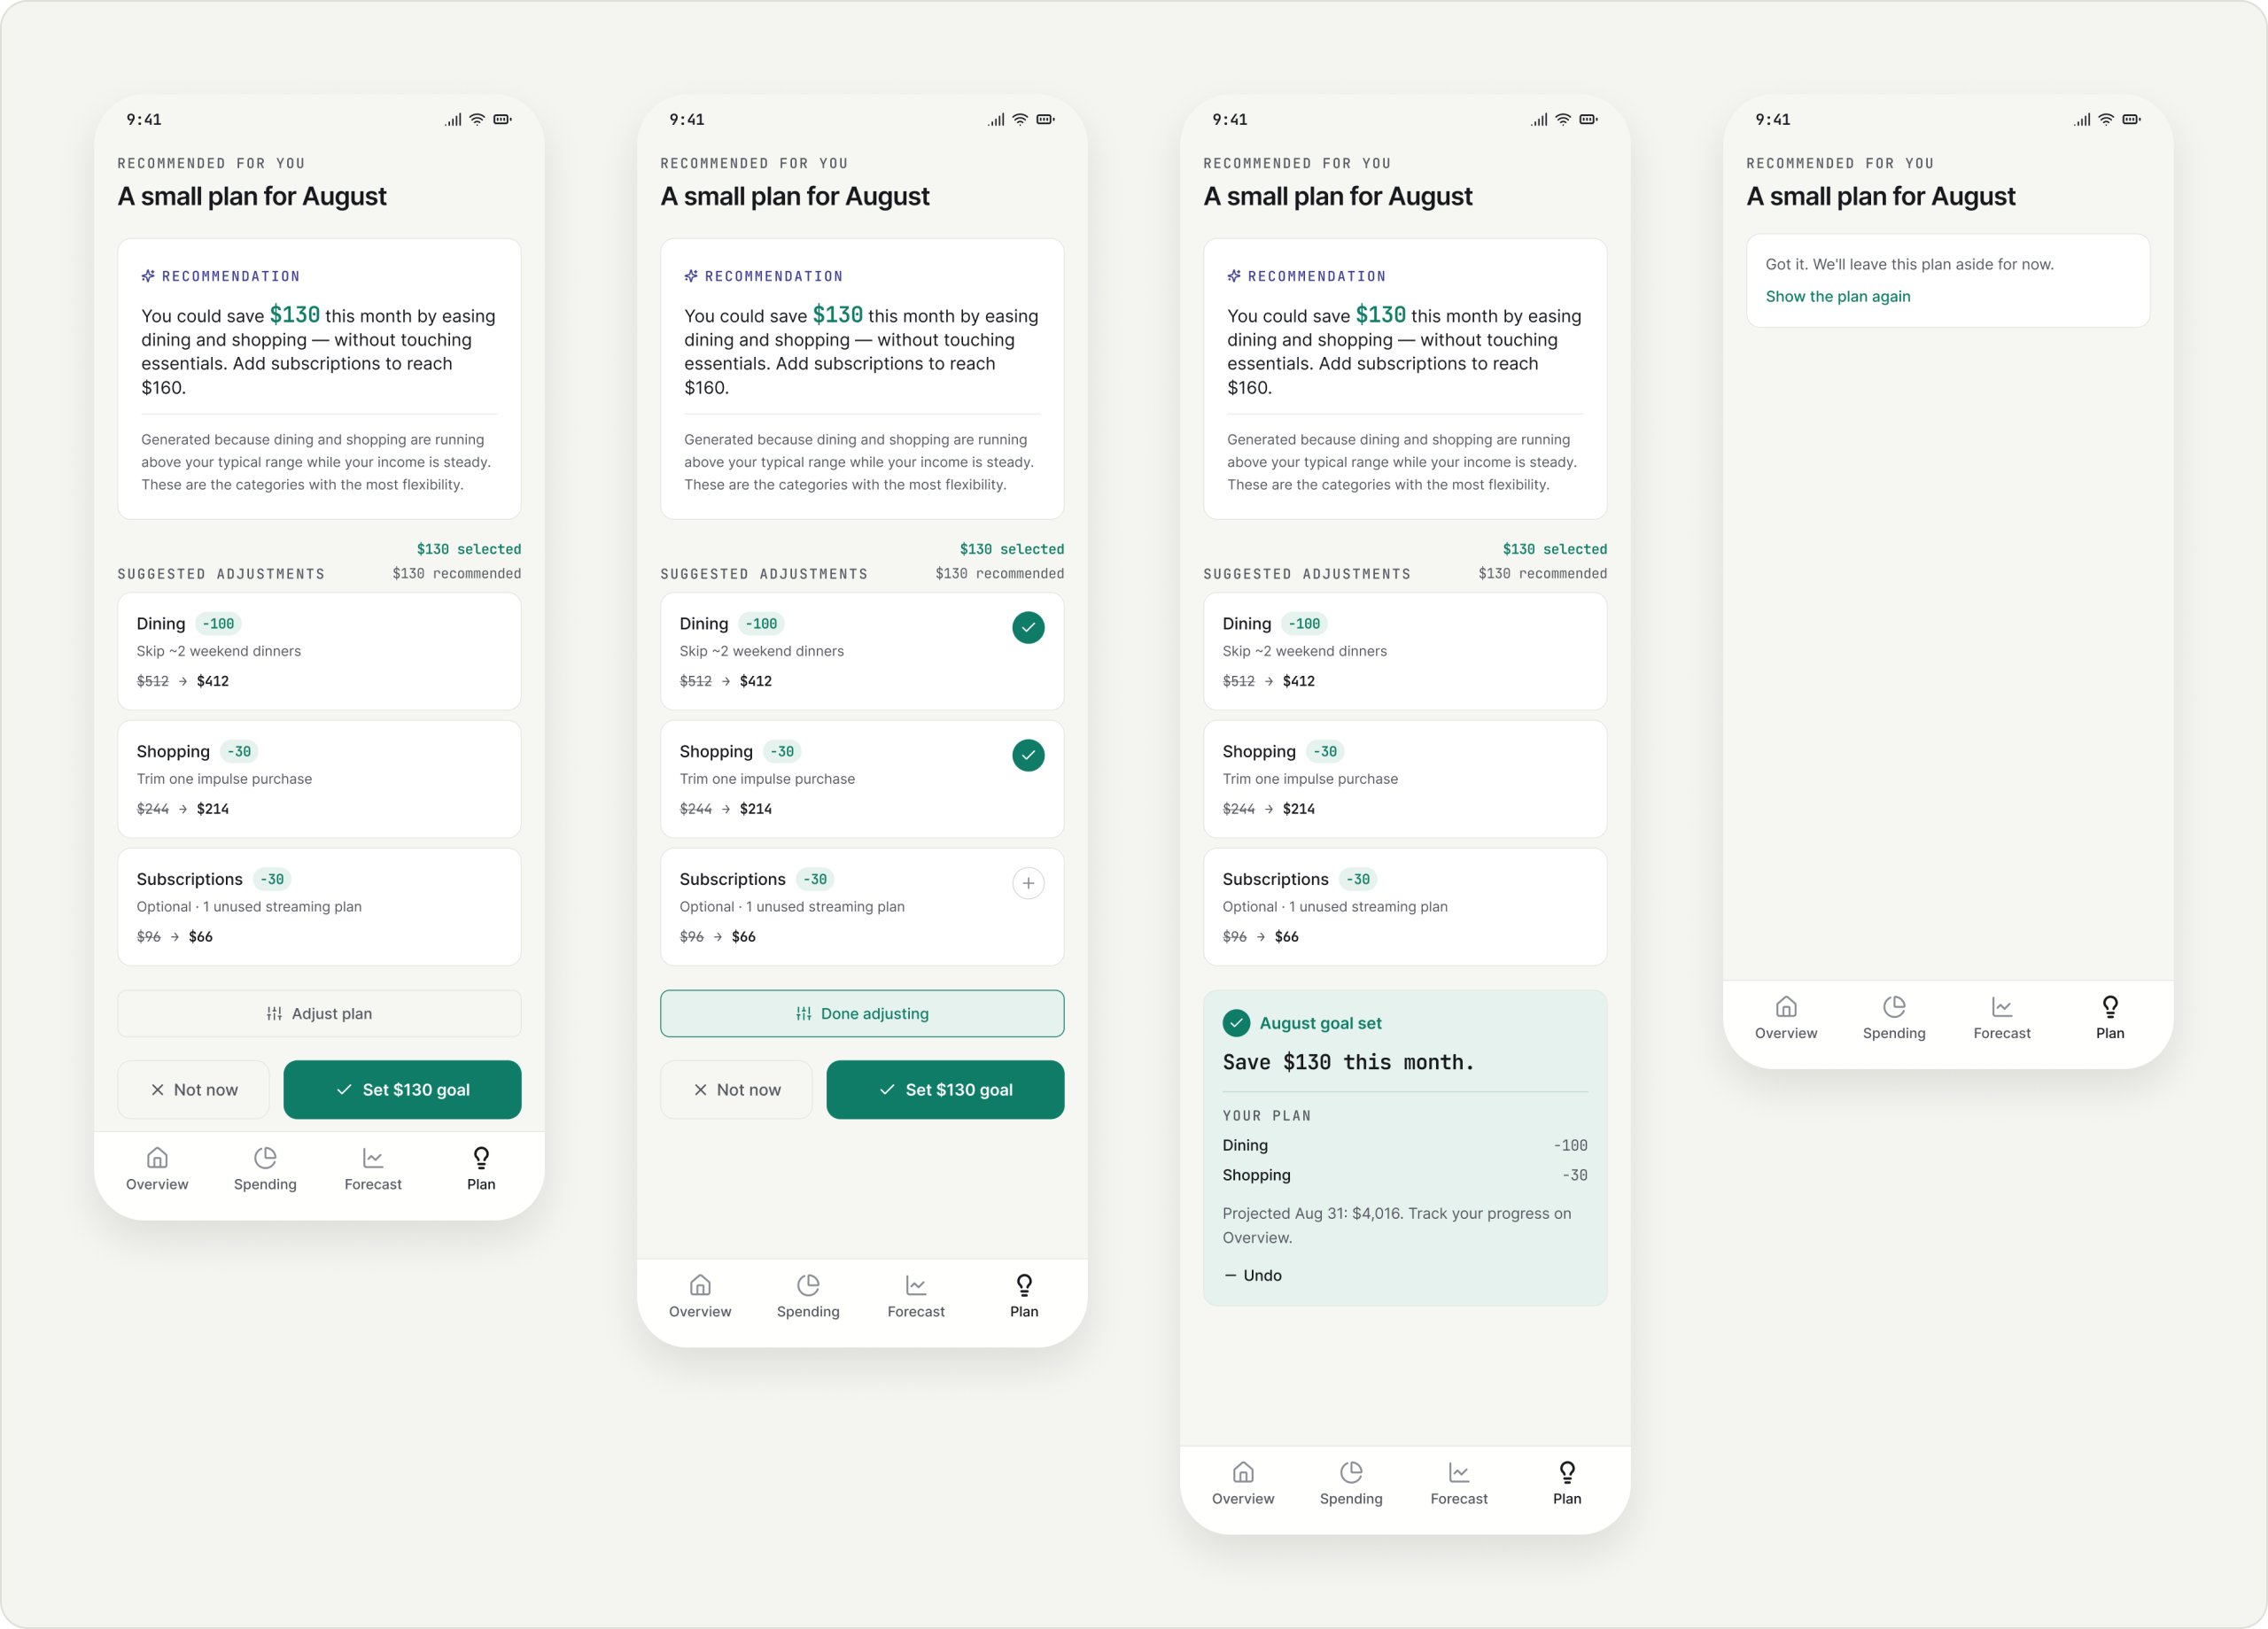
Plan · A small plan for August
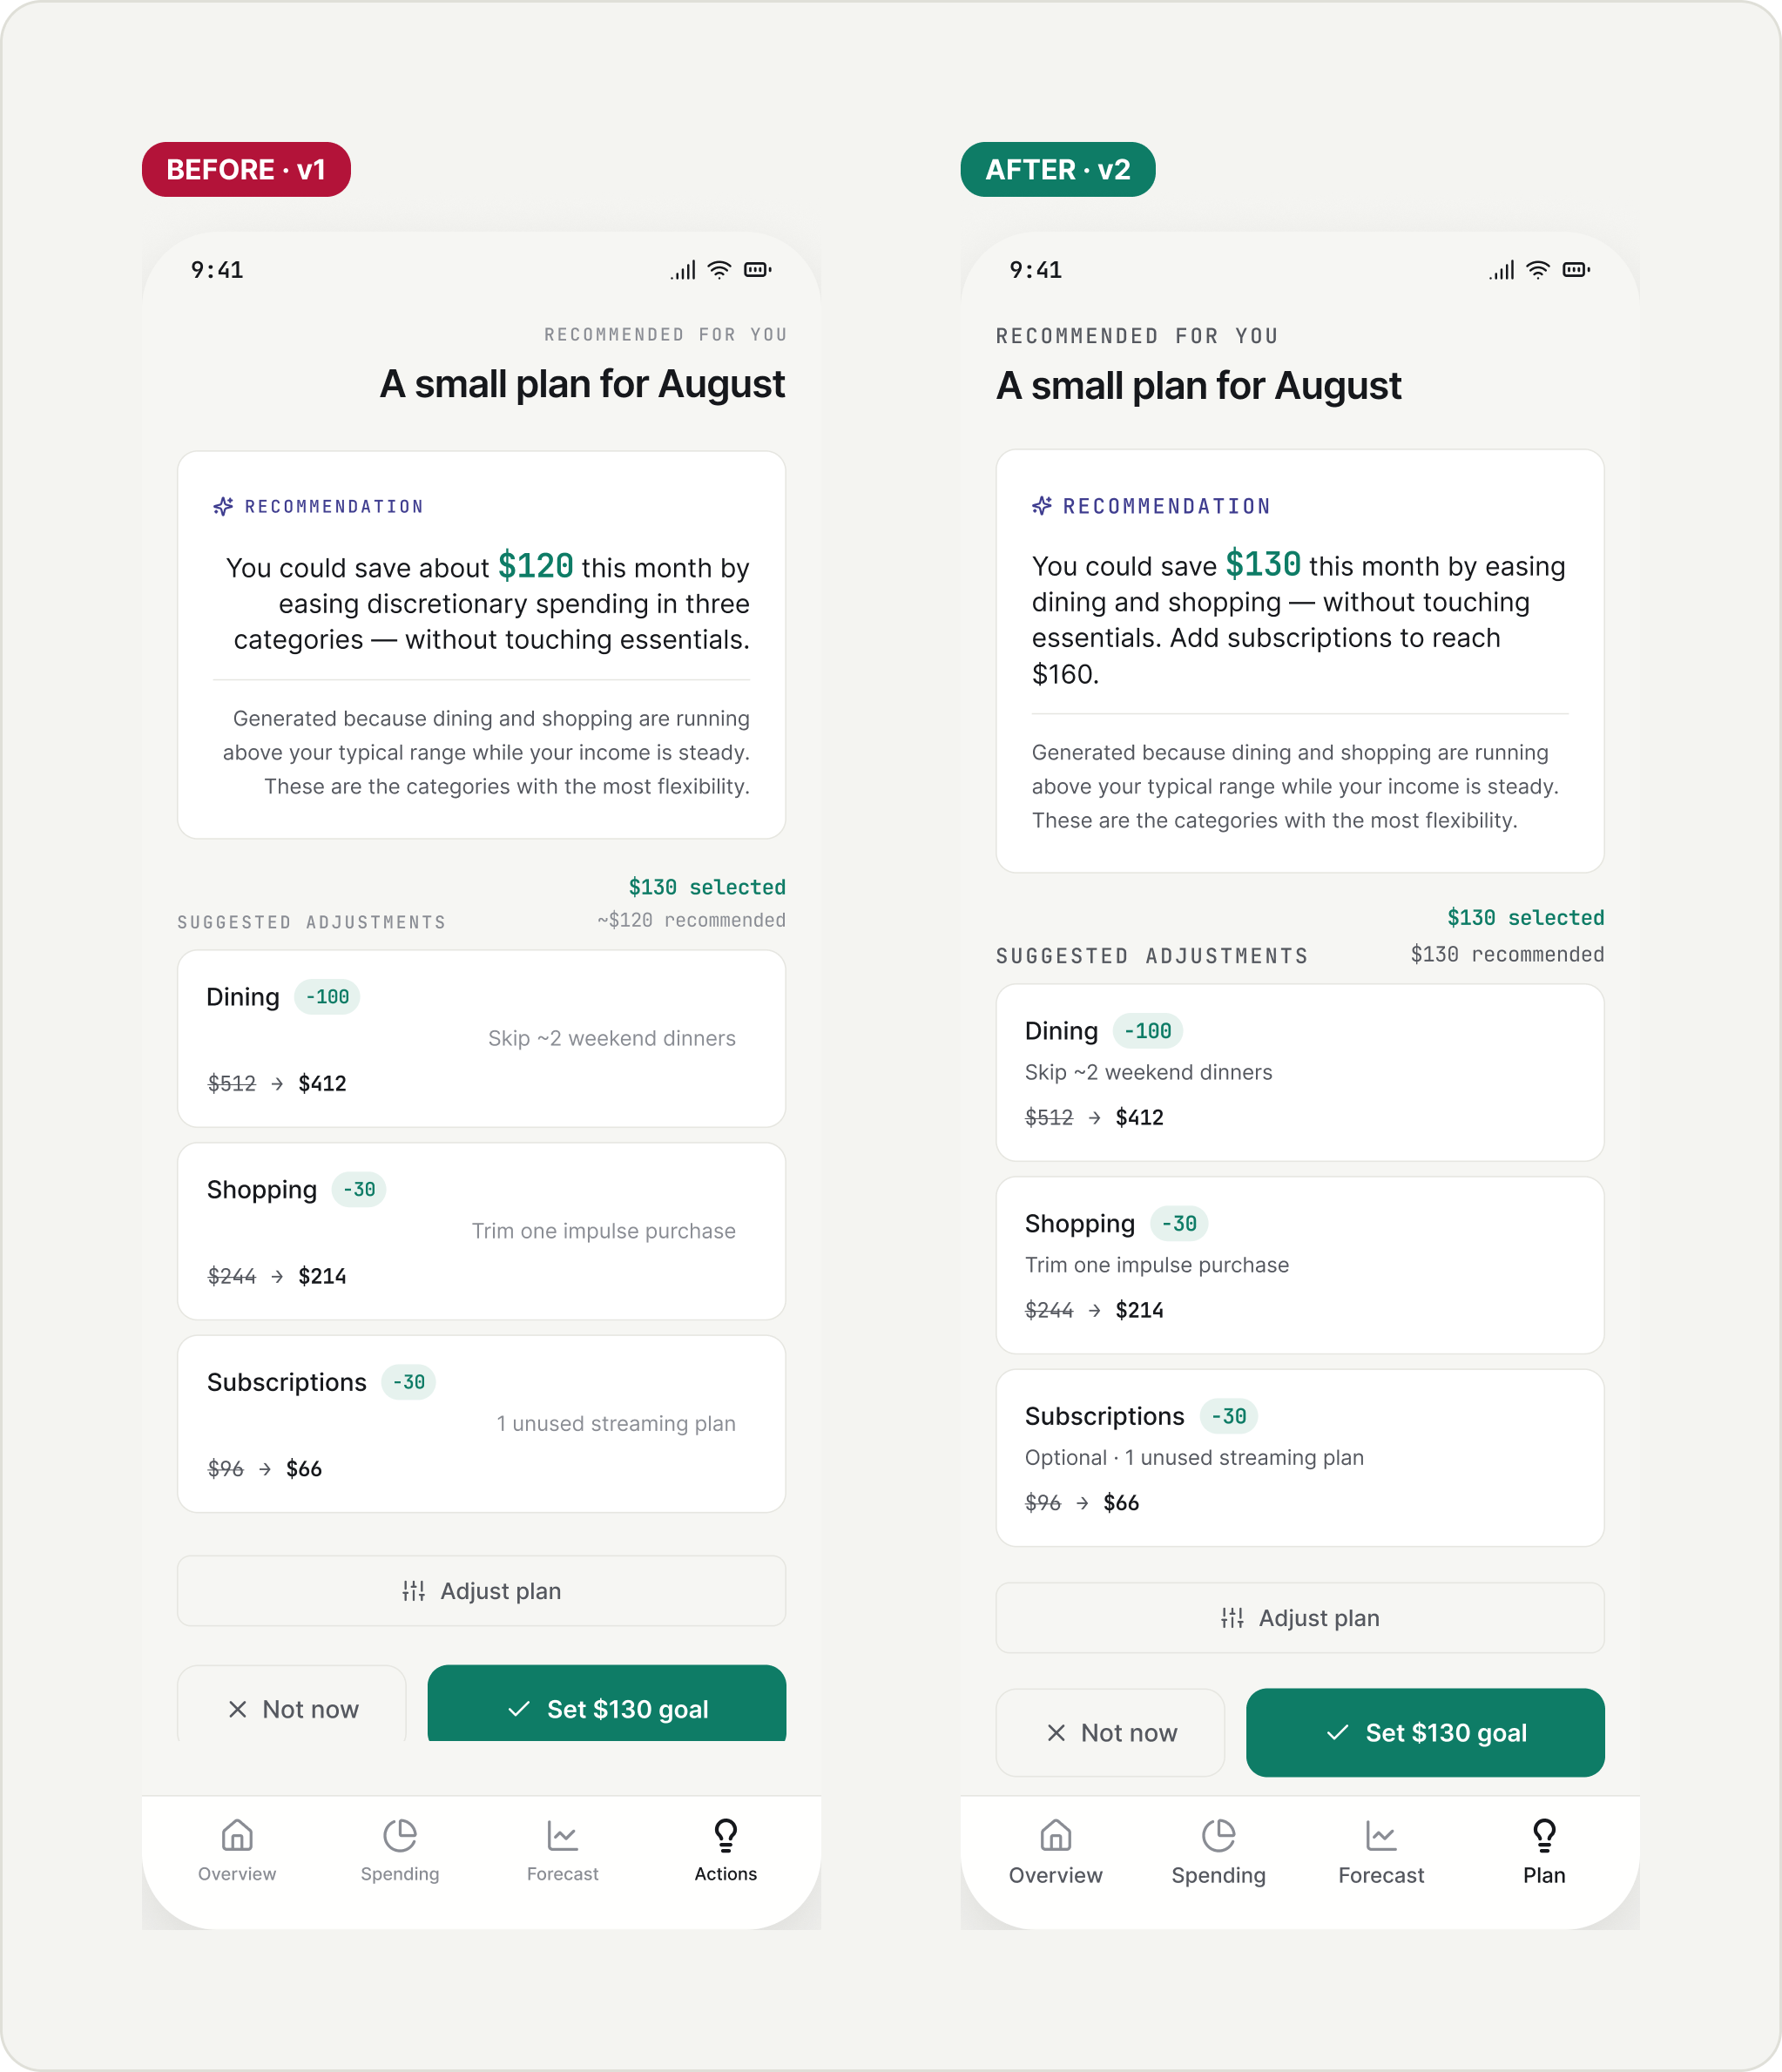
One number. $130 recommended and pre-selected; subscriptions are optional, up to $160.
Editable, reversible. Adjust each part, set the goal, Undo, or say Not now without being nagged.
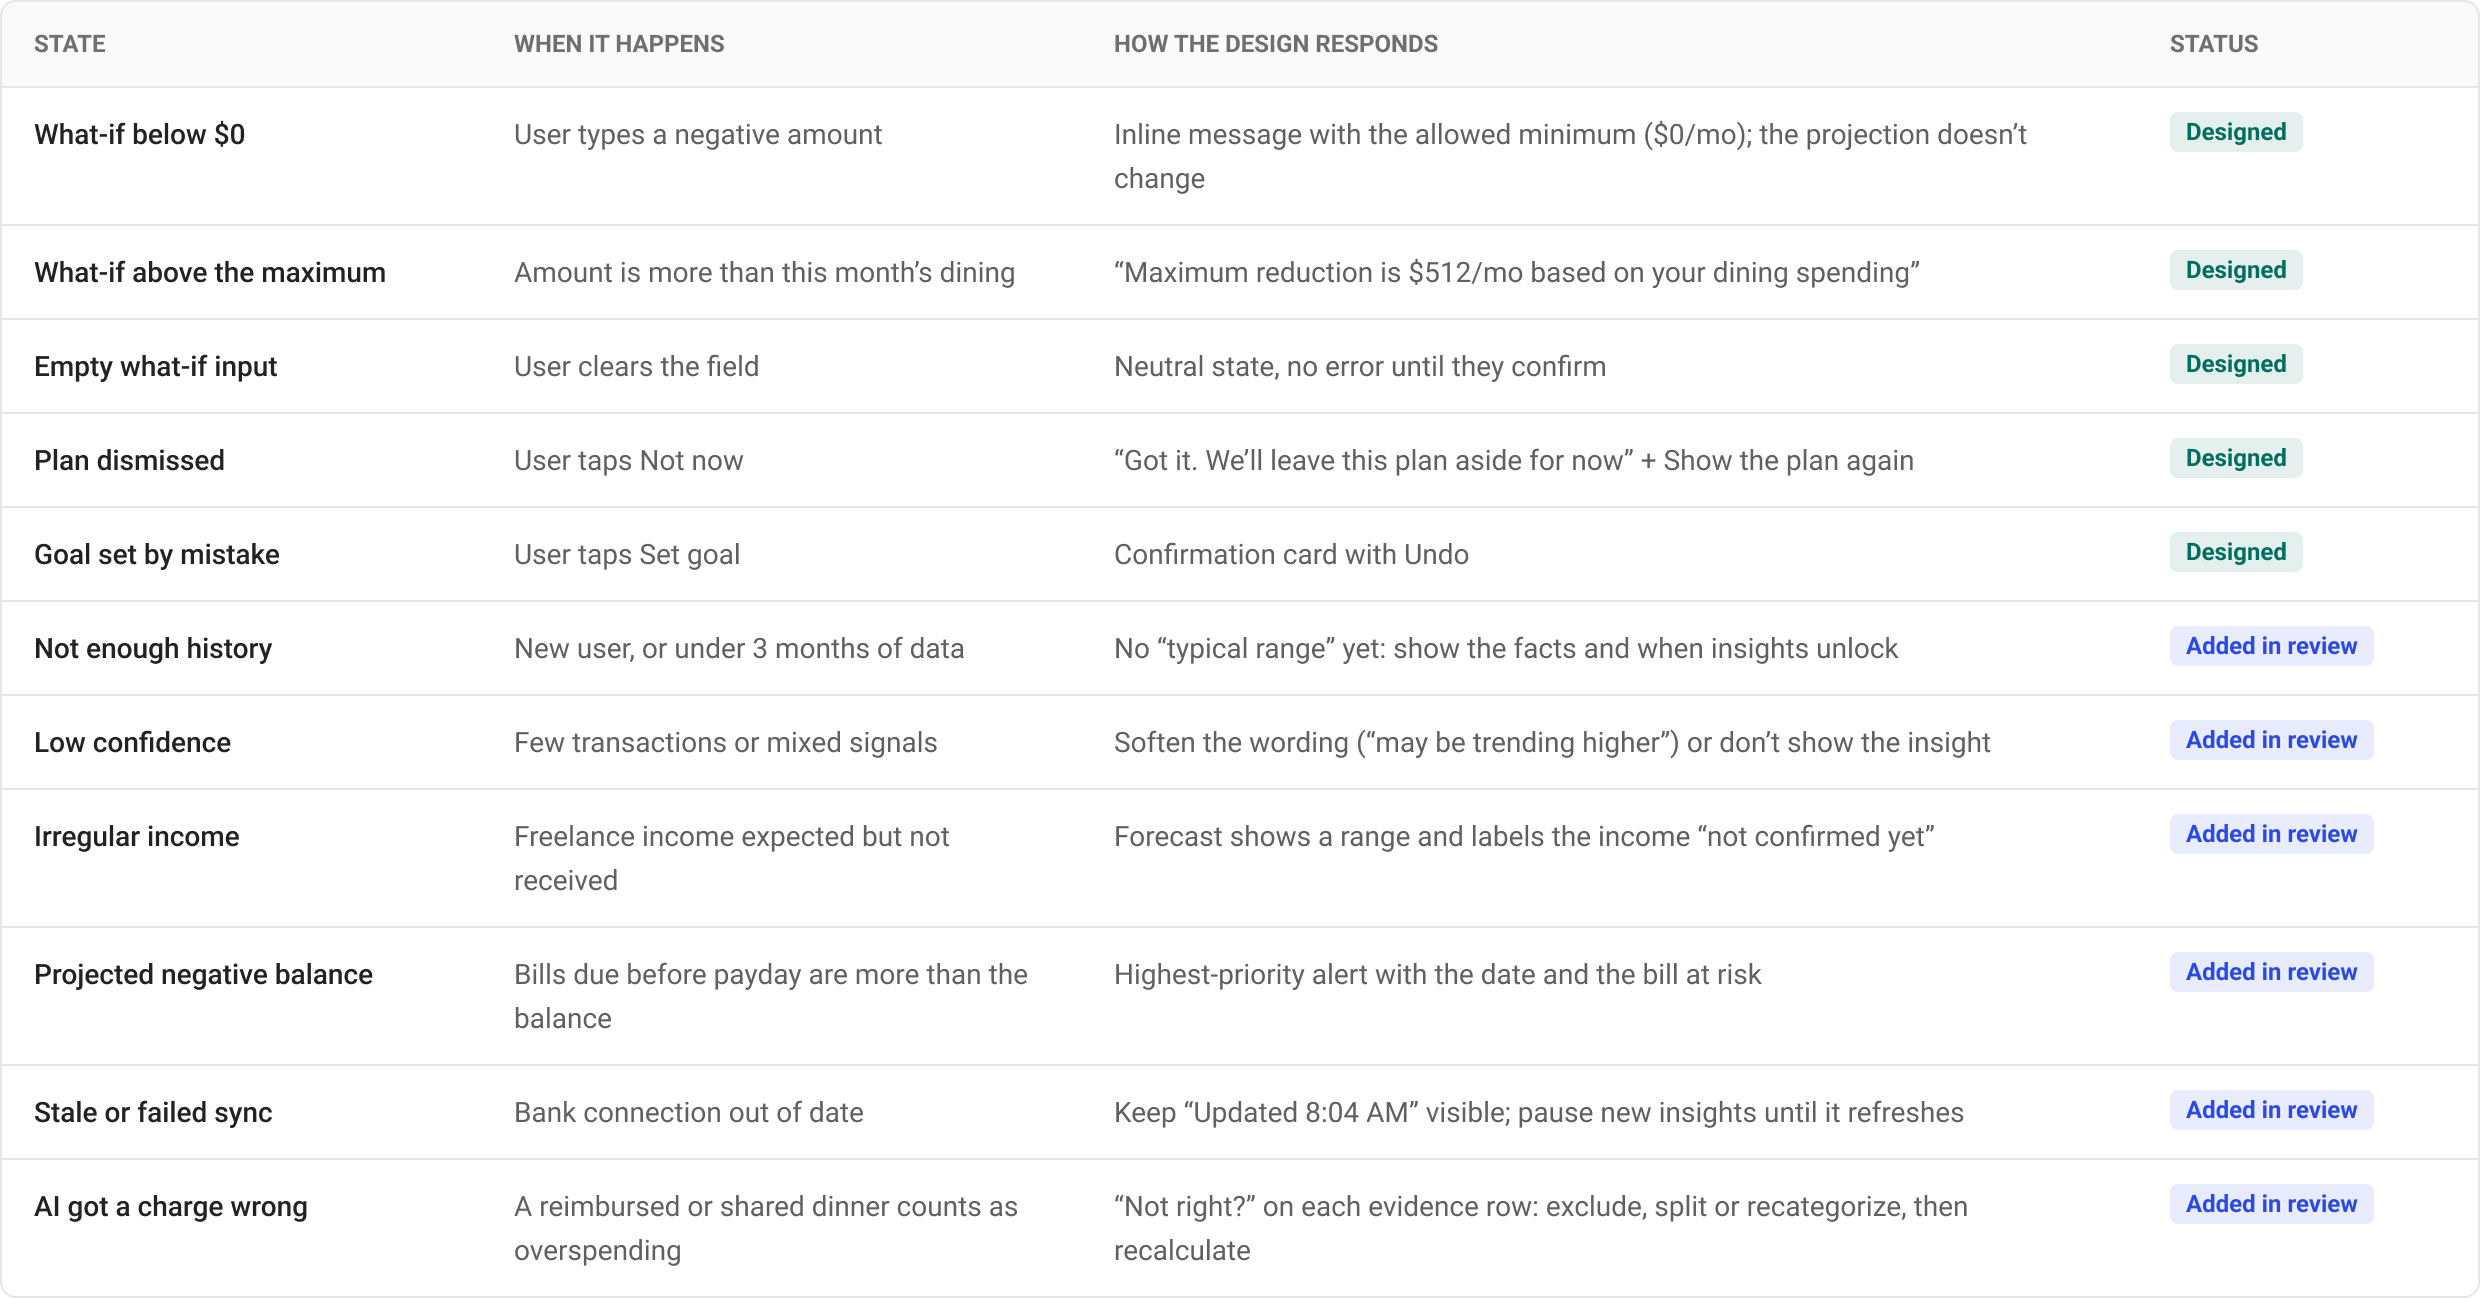
Edge cases & system states
The happy path is one row of this table. The rest are the moments where trust is won or lost.
After the first version, I reviewed my own design the way I’d review a teammate’s: a cognitive walkthrough of the main task, then a heuristic evaluation, with extra care for money accuracy. In a finance product, one number that doesn’t add up costs more trust than any visual issue.
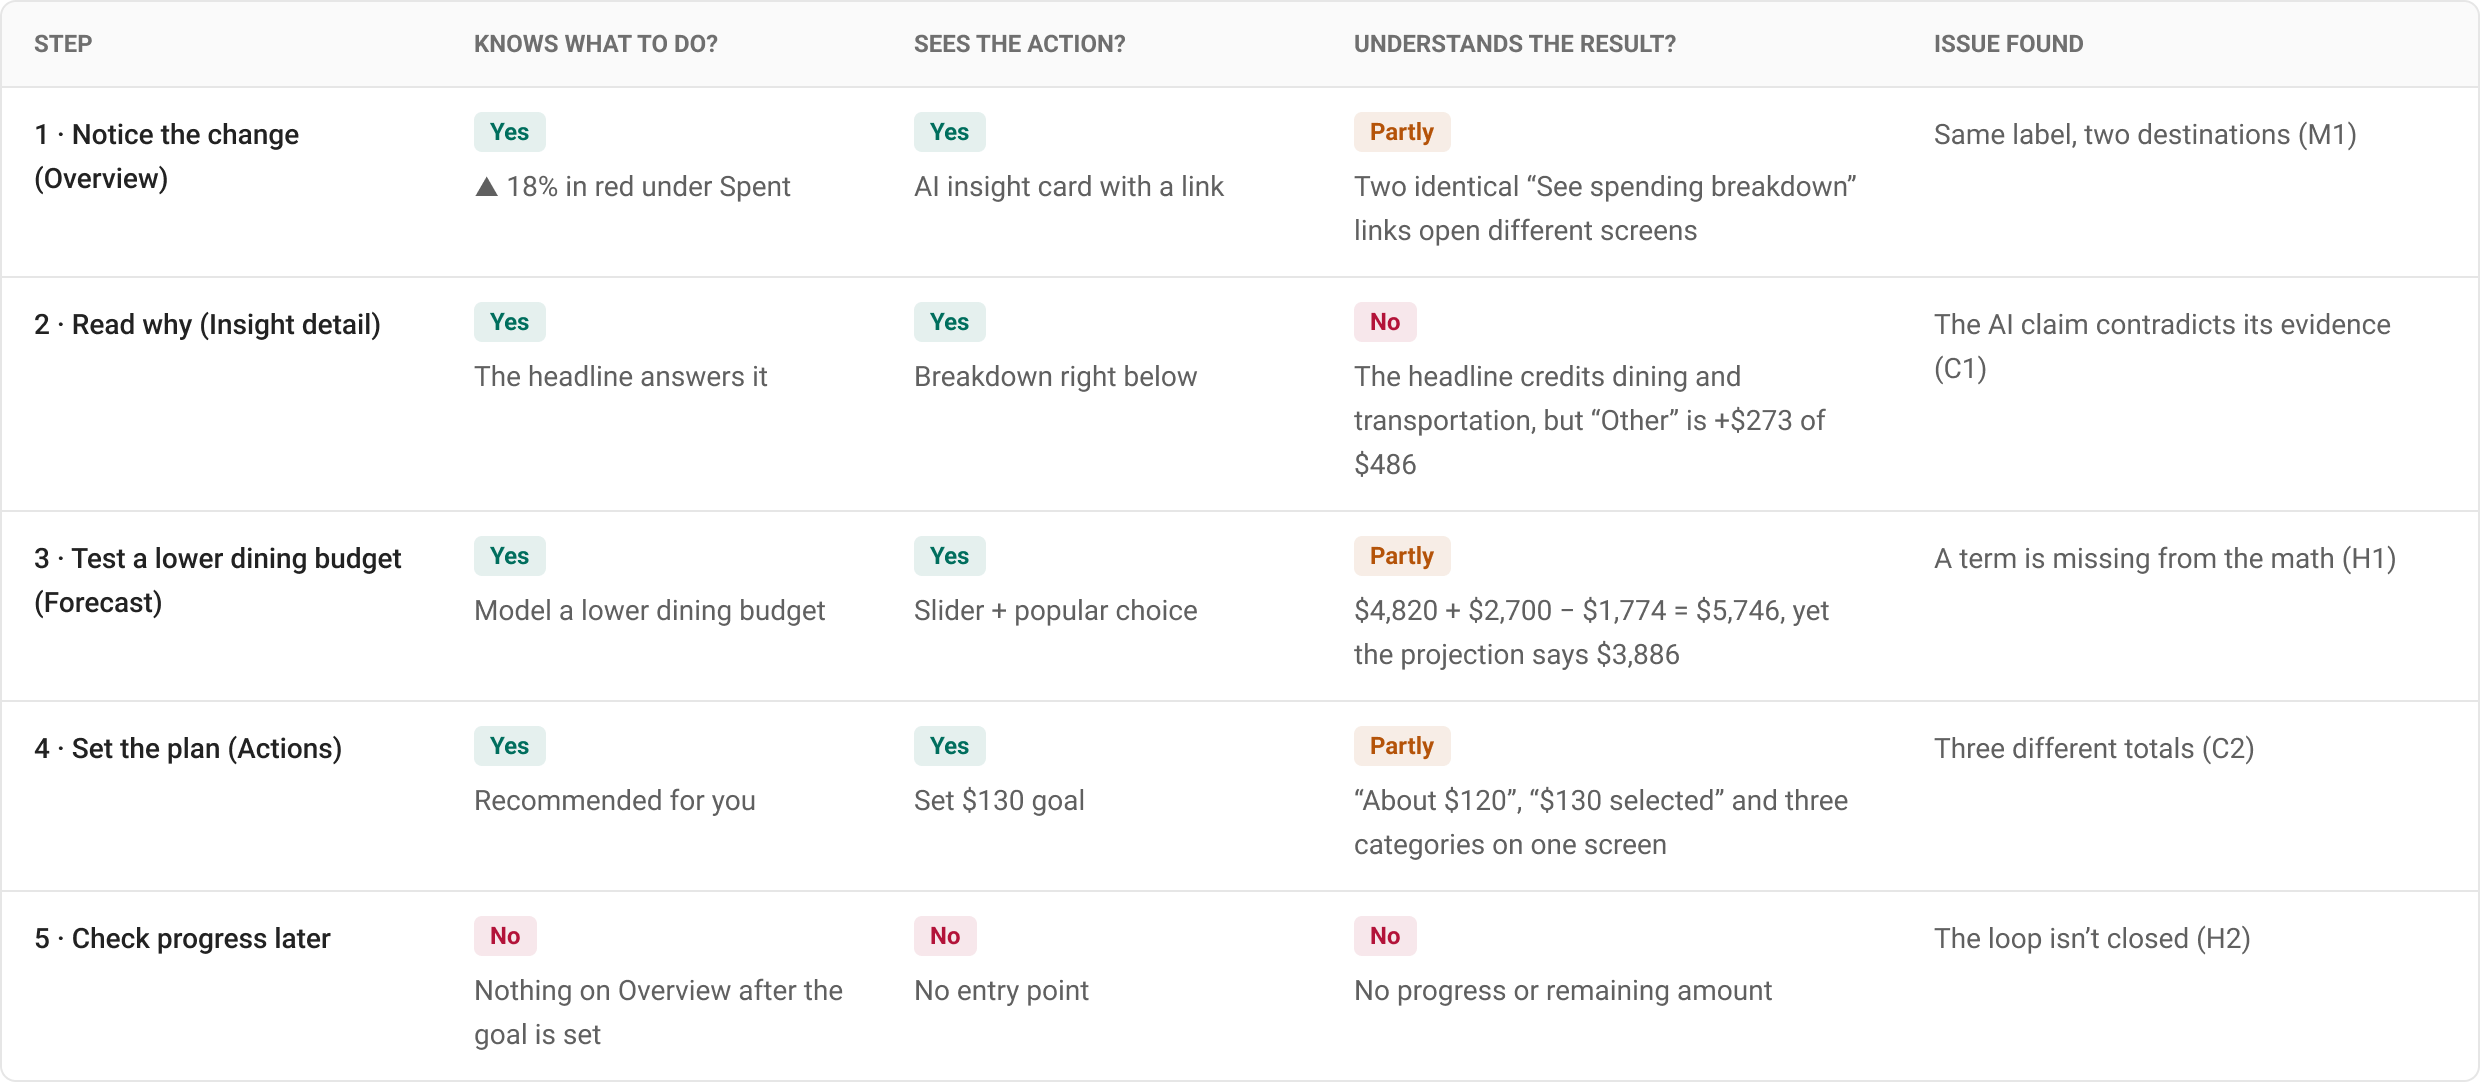
Cognitive walkthrough
Task: “Find out why my spending is up, then set a plan.” For each step: will the user know what to do, will they see the action, and will they understand the result?
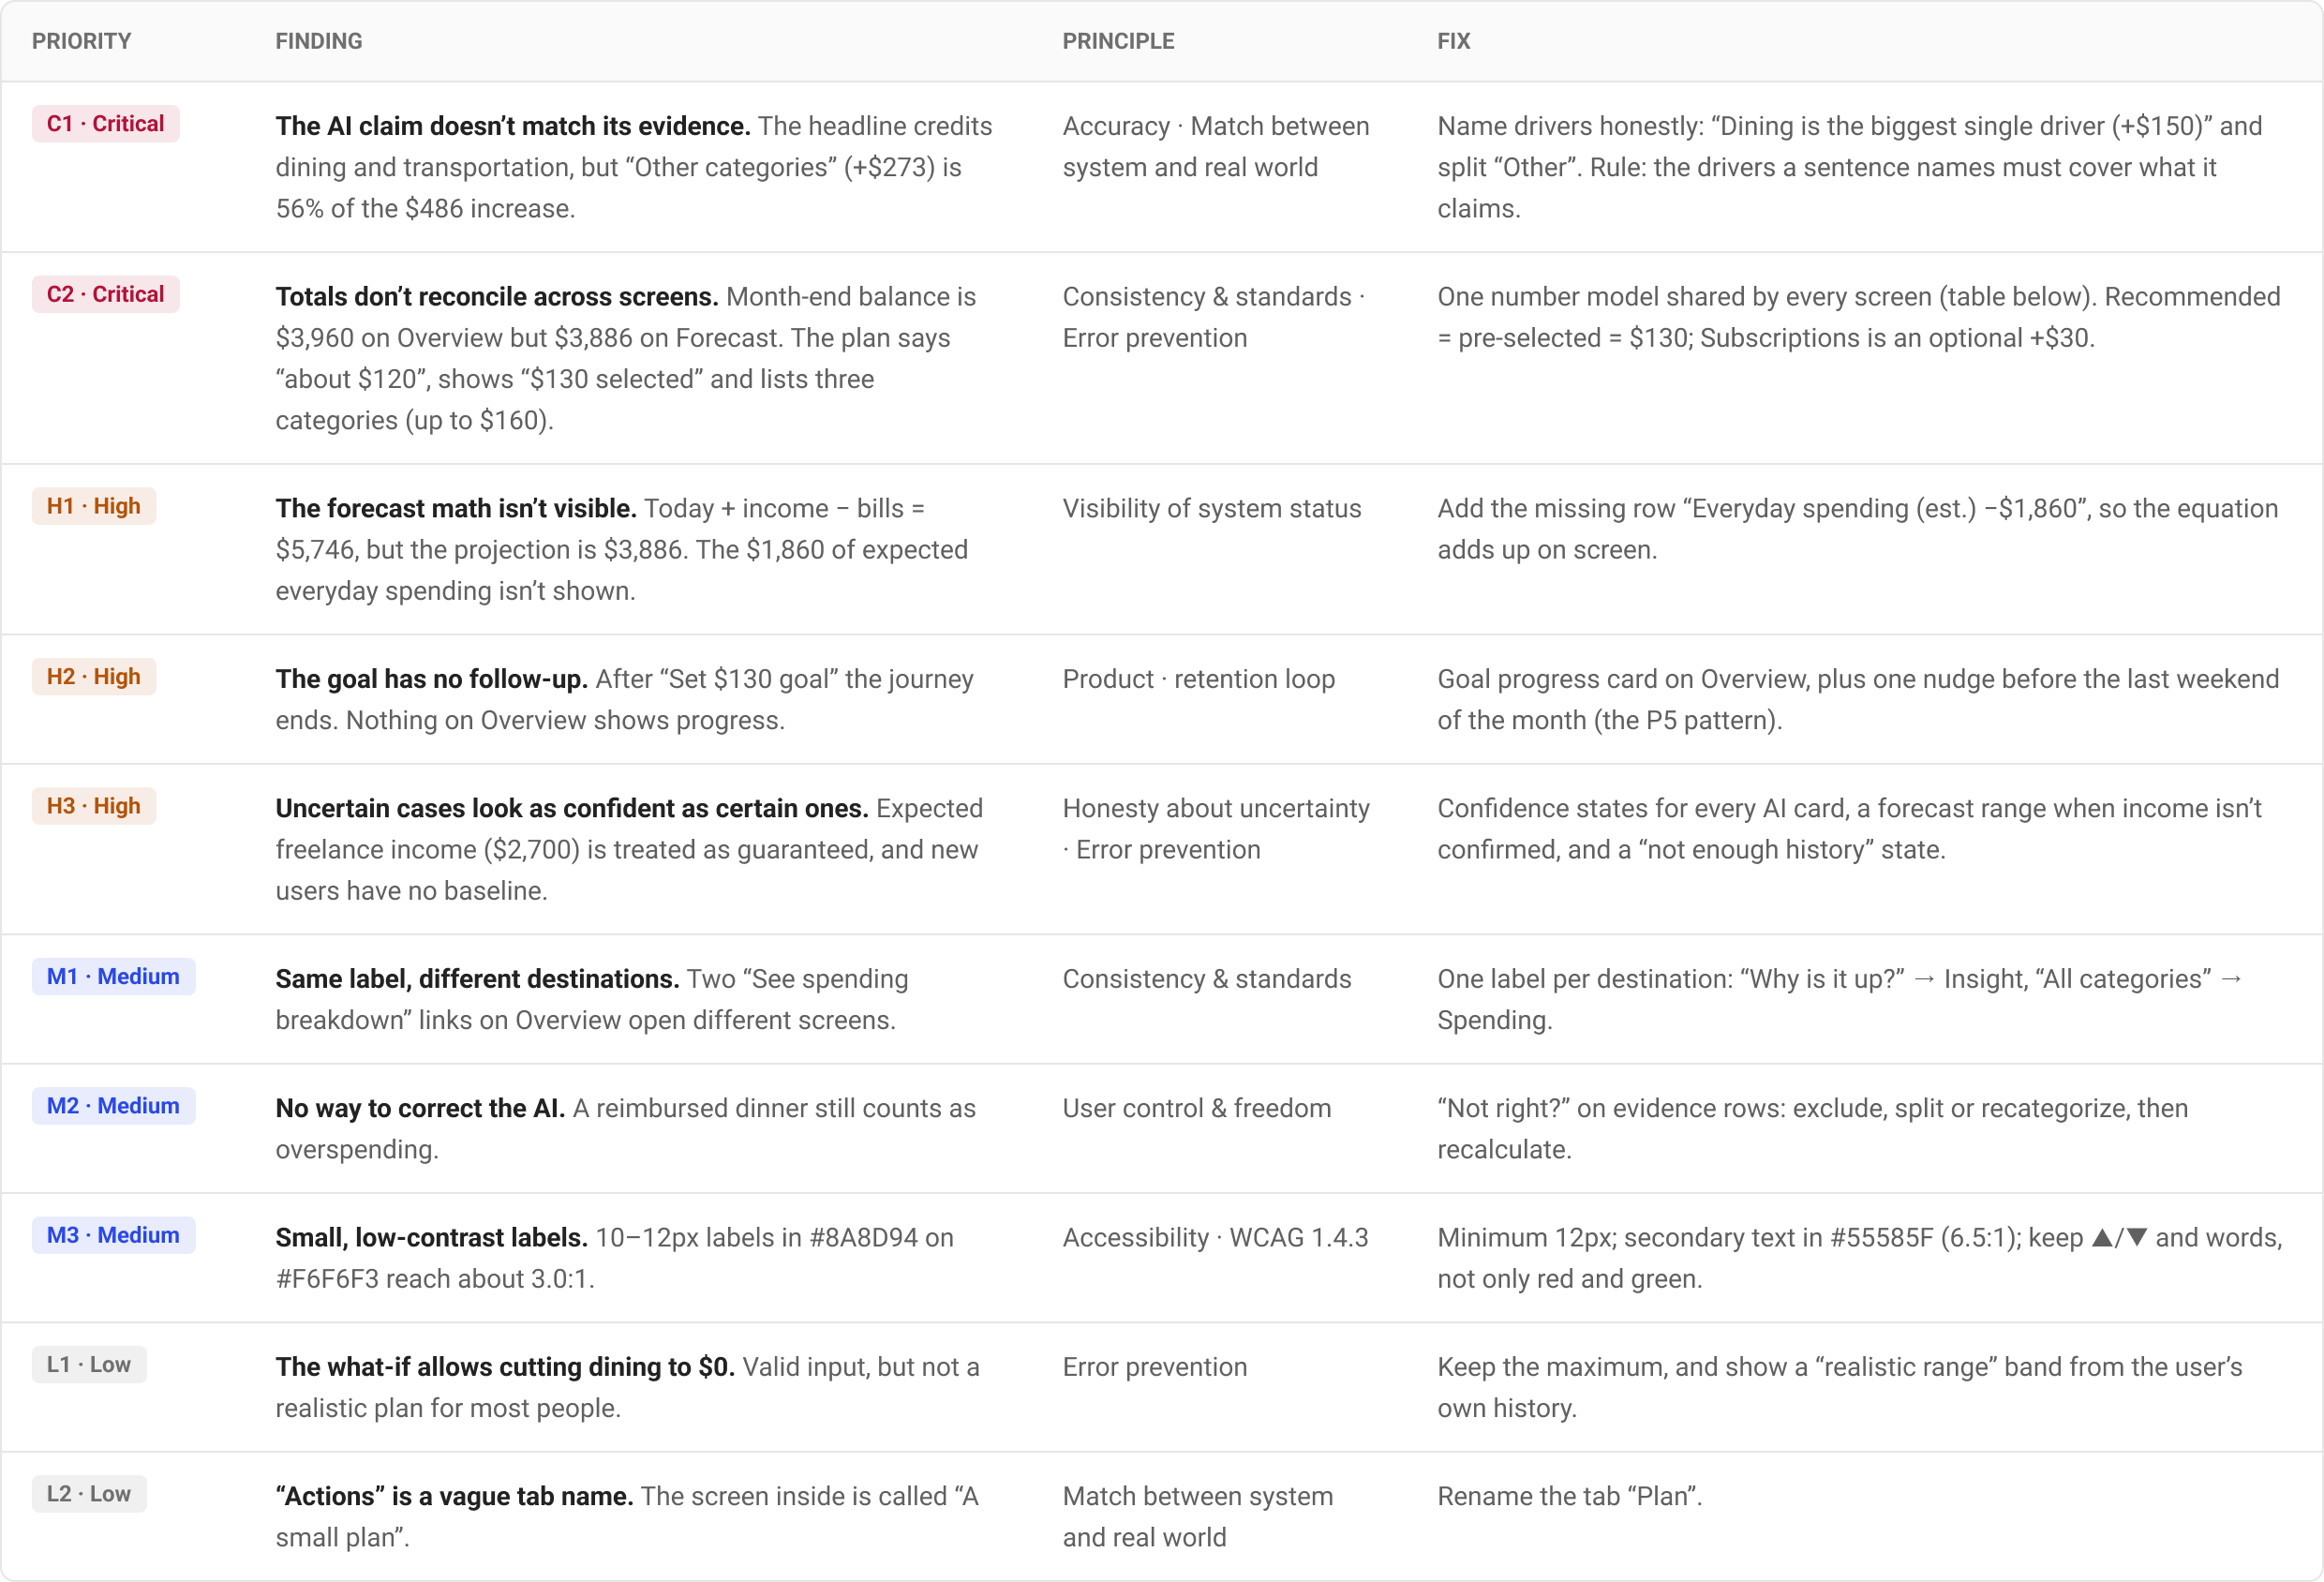
Prioritized findings
Severity weighs how many users hit the issue, how badly it affects trust or money decisions, and whether they can recover on their own.
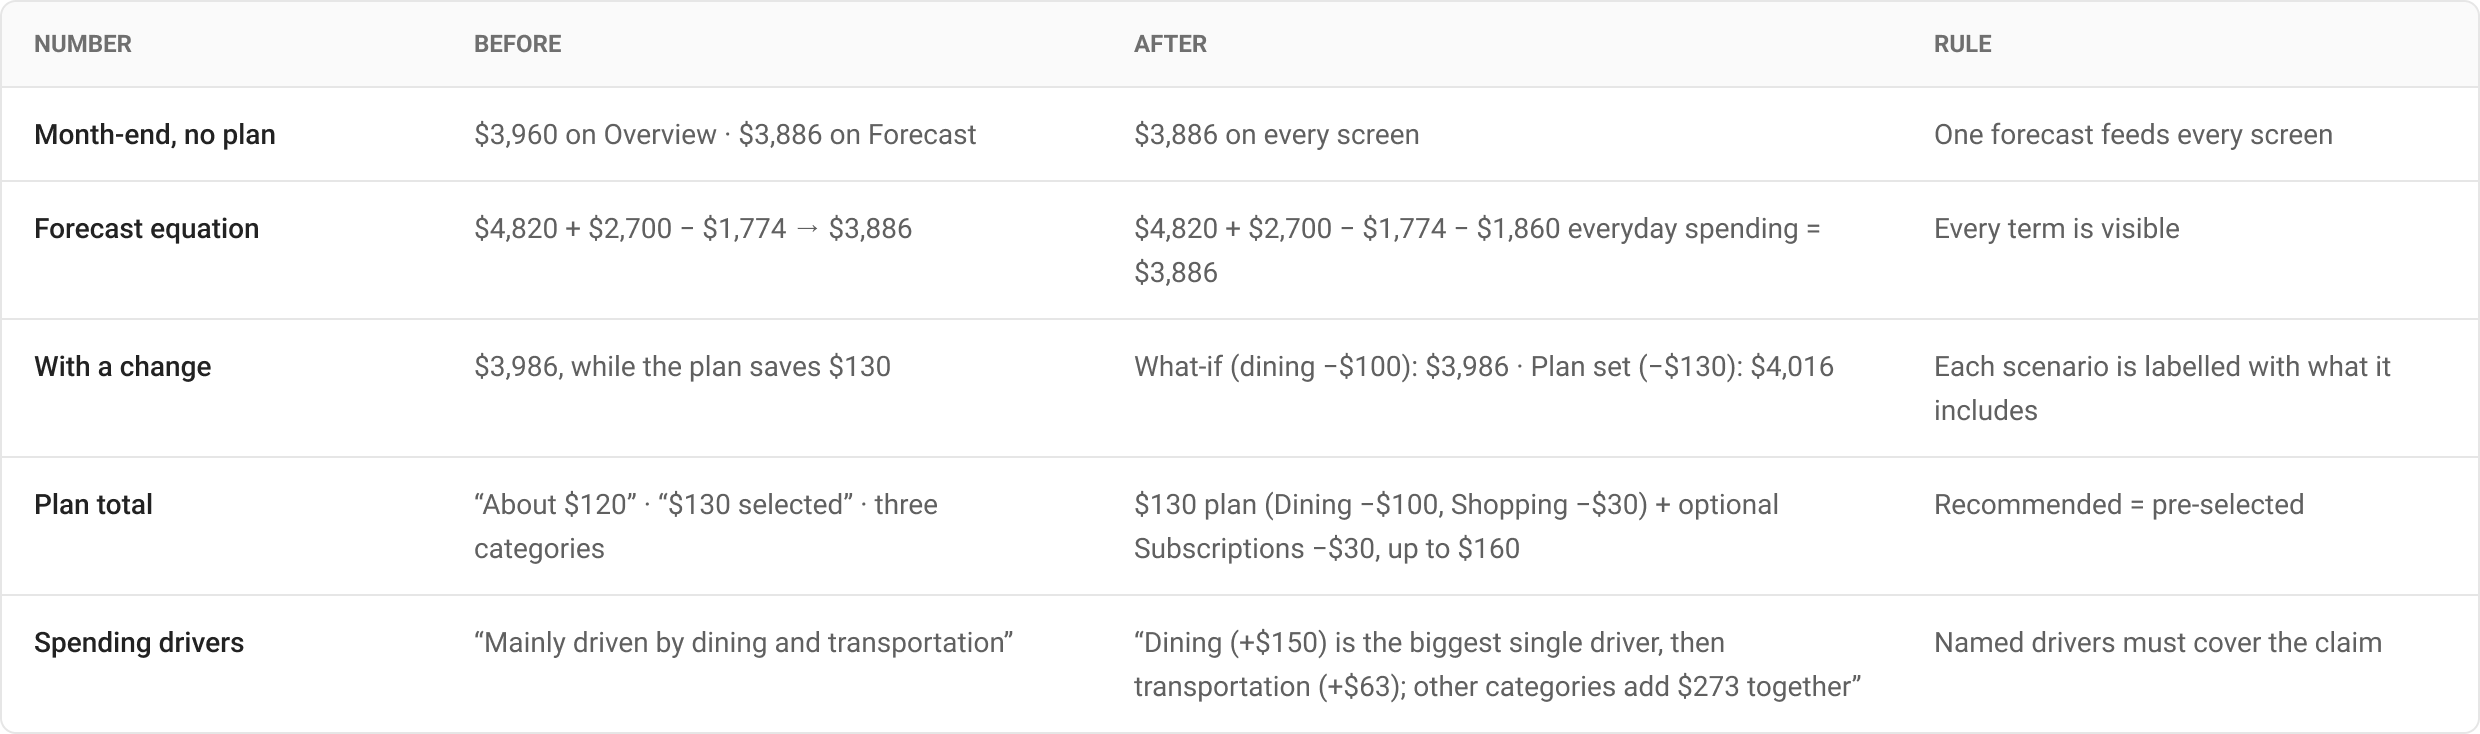
Making the numbers add up
The fix for the critical issues wasn’t visual. Every screen now reads from one number model, and each scenario says what it includes.
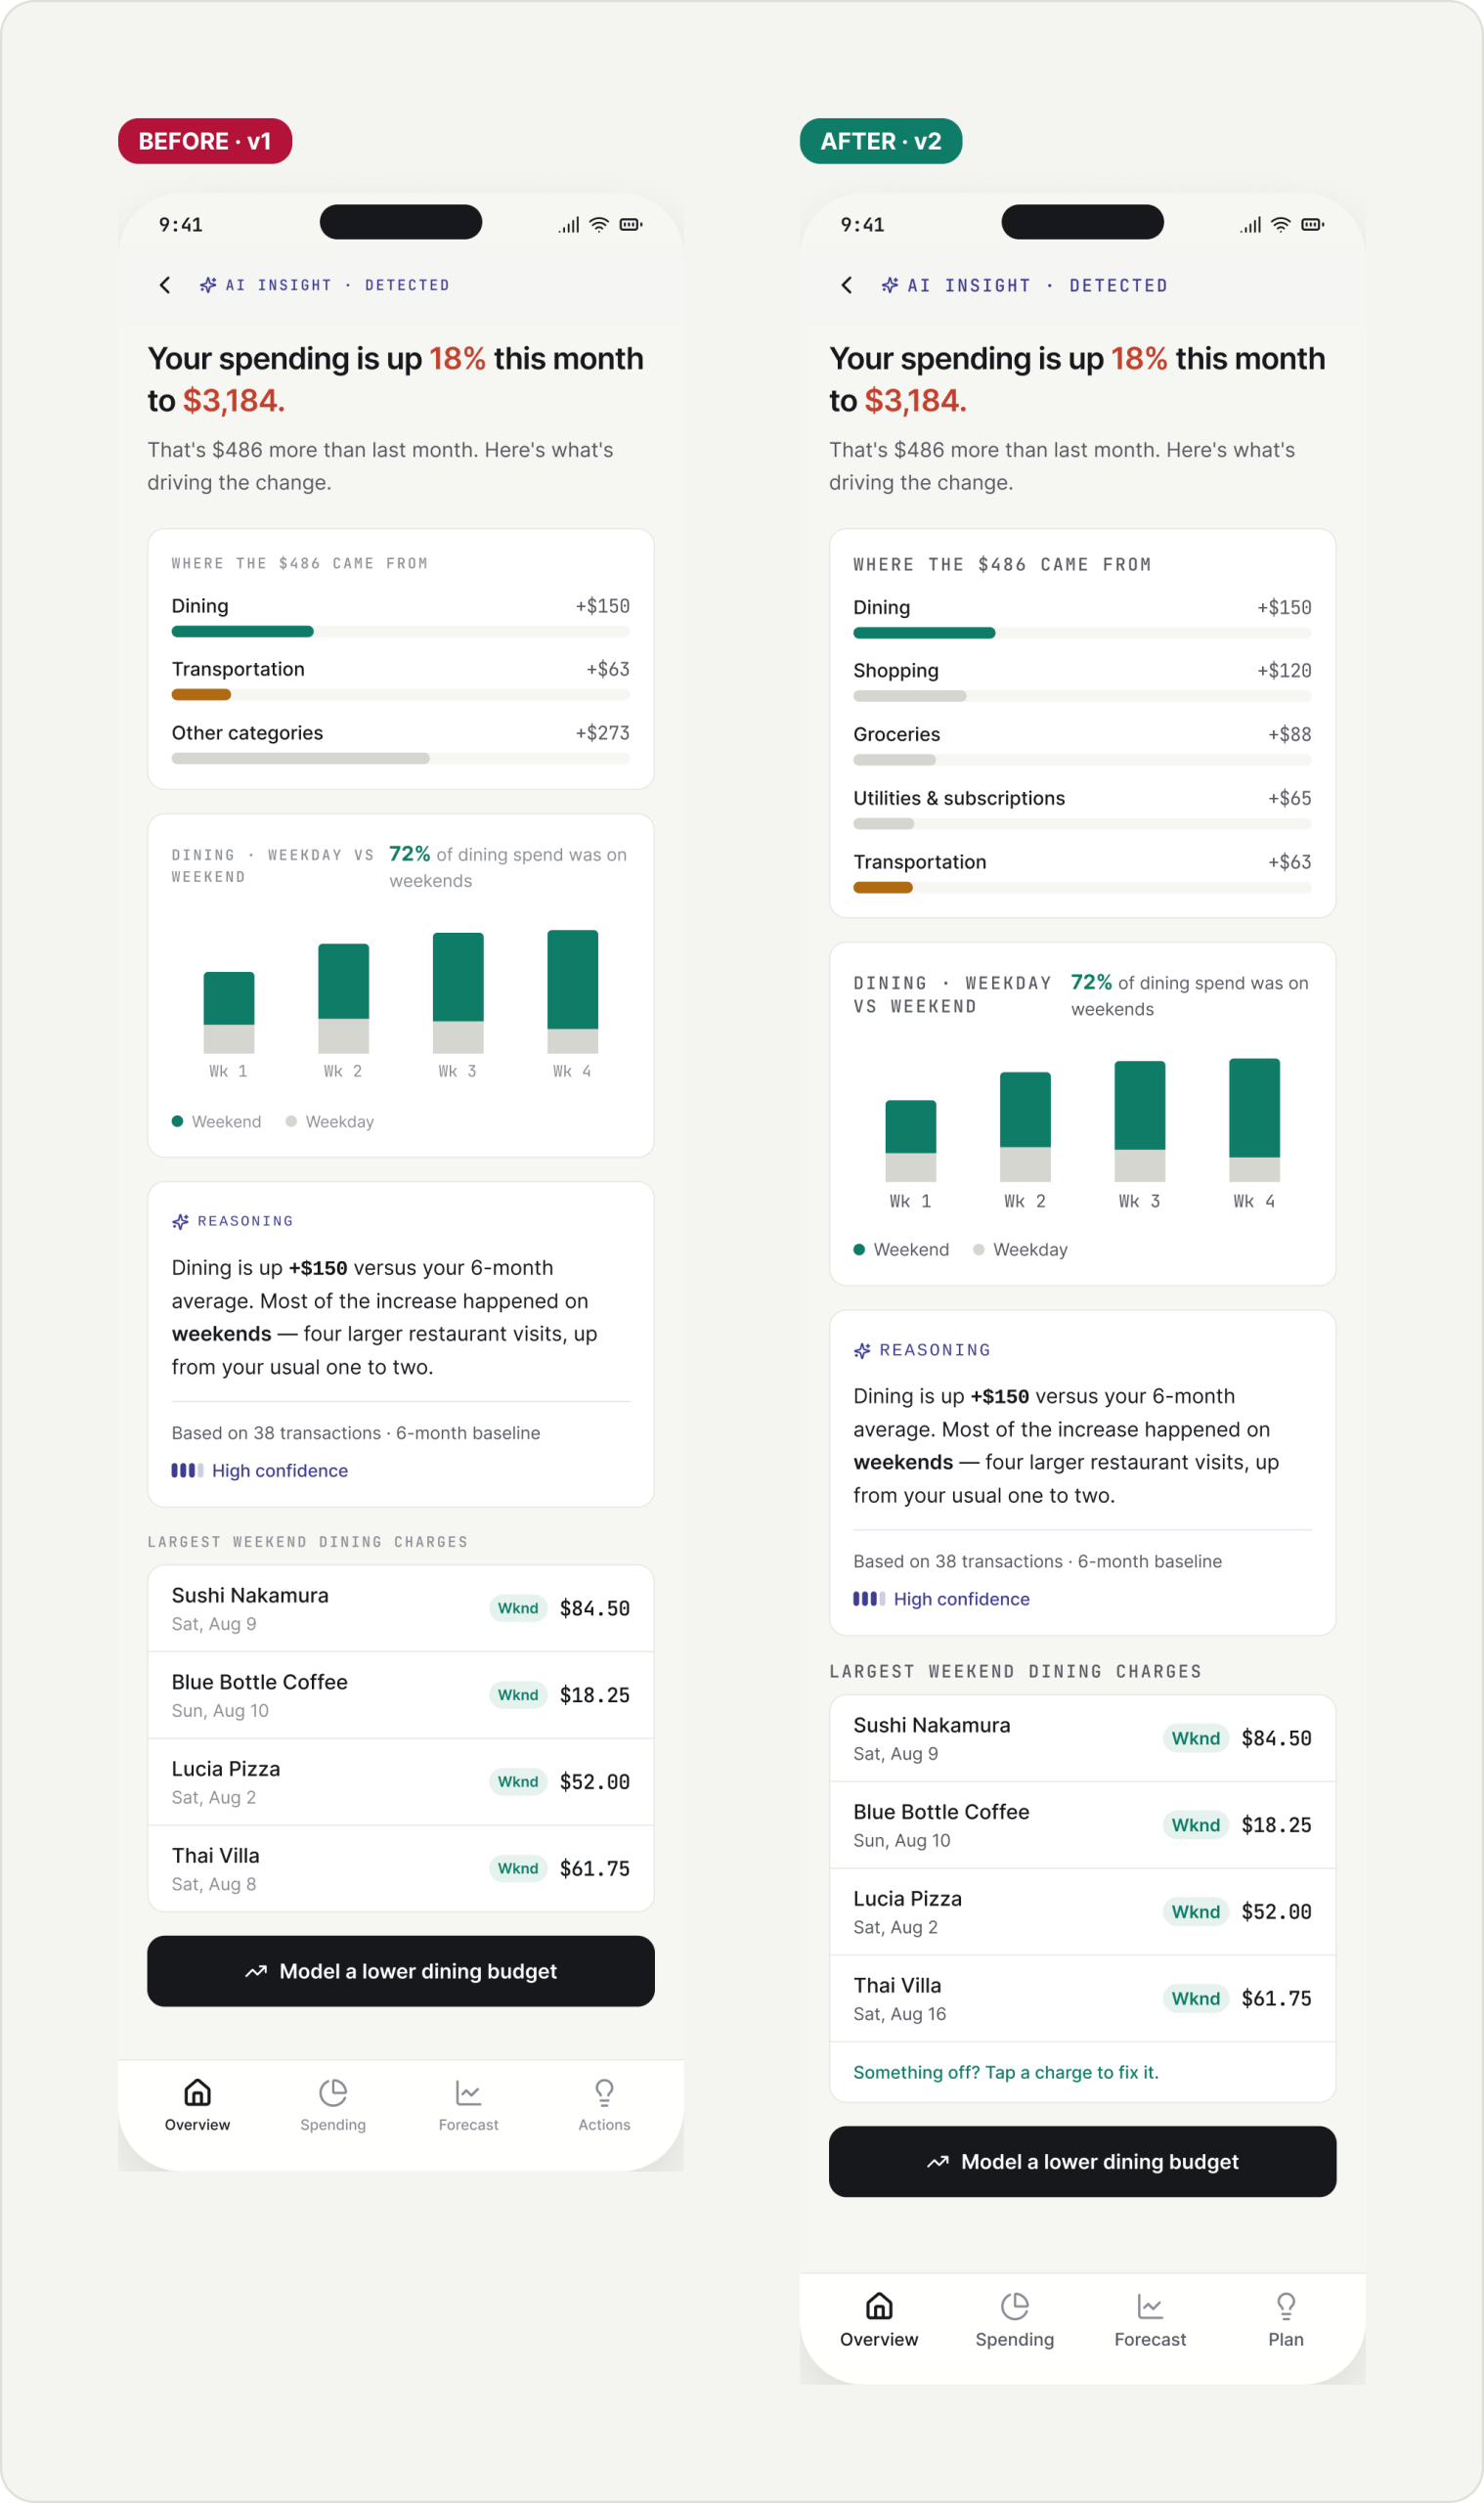
Before → after
I applied every fix to the real screens and kept the original as the Before.
The AI claim now matches its evidence
The headline names Dining as the biggest single driver, and “Other categories” is split, so the sentence and the breakdown tell the same story.
A clearer, more readable Overview
Each link names its destination, the month-end balance matches the forecast, muted text moves from 3.0:1 to 6.5:1 contrast, and the “Actions” tab becomes “Plan”.
Forecast math you can follow
An “Everyday −1,860” column makes the header add up, unconfirmed income is called out, and the slider shows a realistic range.
One number in the plan
$130 recommended is the same $130 that’s pre-selected, and the goal shows the projected balance once it’s set.
The plan comes back to Overview
After “Set $130 goal” the journey used to end. Now Overview shows progress, one timely nudge and a Safe to spend number.
The patterns behind v2
One AI card anatomy shared by every insight, projection and recommendation, plus the new patterns: Safe to spend, goal progress, confidence states and correcting the evidence.
6. Measure & Validate
If the design works, more users go from noticing a change to acting on it, and they end the month closer to their own plan, without trusting the app less. Because this is a concept, validation starts with a usability test on the prototype; the metrics are what I’d track after launch.
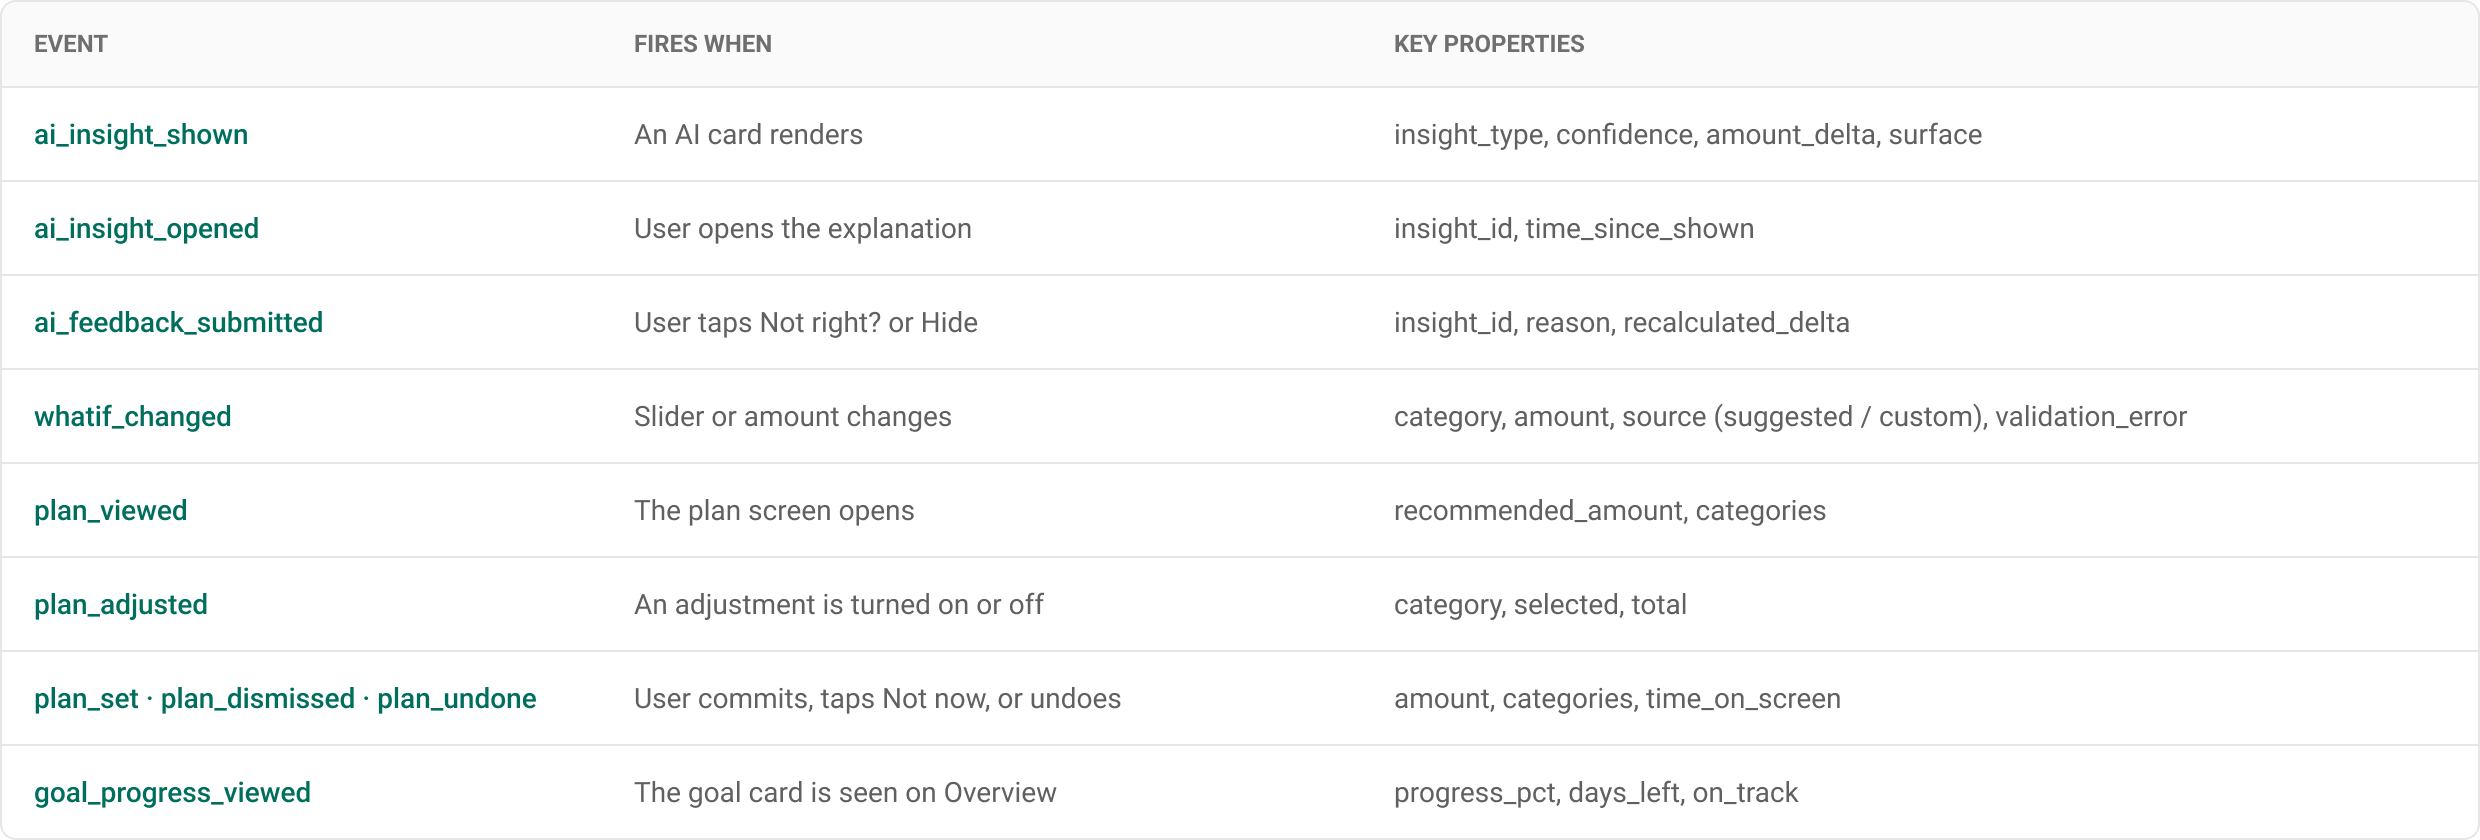
Event tracking plan
Every AI card logs what it showed and how confident it was, so trust can be measured, not guessed.
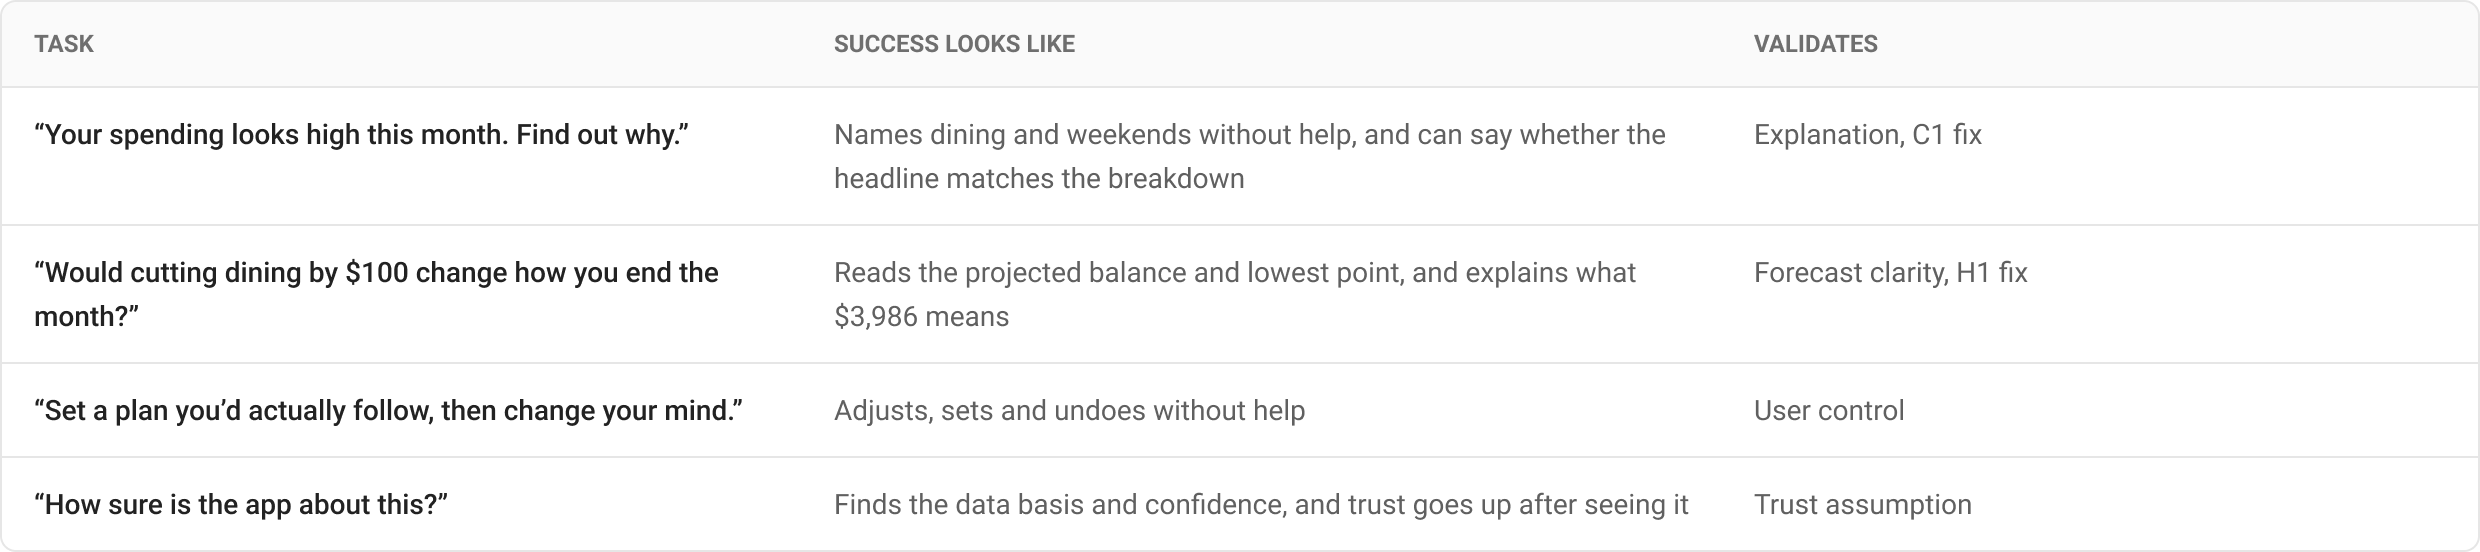
Usability test plan
5–6 participants who use a banking app weekly, moderated, on the prototype. I’d measure task success, time on task, errors, the Single Ease Question, a comprehension check of every number on screen, and trust before and after seeing the reasoning.
A/B tests after launch
Decision rule
Ship a variant only if the primary metric improves and no trust guardrail gets worse, agreed with PM and Data before the test starts. The forecast only ships if backtesting keeps its month-end error inside an agreed limit.
7. Lesson learned
AI in finance is judged on the numbers, not the polish. My first version had a strong flow, but walking through it step by step showed that the AI’s own sentence didn’t match its evidence, and three screens showed three different totals. In a money product that breaks trust faster than any layout issue.
The fix wasn’t more AI: it was one shared number model, visible math, honest confidence, and a loop that brings users back to their plan. Next time I’d write the number model before the first screen, and test the explanation, not just the interface.